
Compare Raj Packaging with Similar Stocks
Dashboard
Weak Long Term Fundamental Strength with a -24.78% CAGR growth in Operating Profits over the last 5 years
- Company's ability to service its debt is weak with a poor EBIT to Interest (avg) ratio of 0.25
- The company has been able to generate a Return on Equity (avg) of 3.22% signifying low profitability per unit of shareholders funds
Total Returns (Price + Dividend) 
Latest dividend: 0.5 per share ex-dividend date: Sep-16-2021
Risk Adjusted Returns v/s
Returns Beta

News

Raj Packaging Industries Ltd Downgraded to Sell Amid Weak Fundamentals and Bearish Technicals
Raj Packaging Industries Ltd has seen its investment rating downgraded from Hold to Sell as of 29 June 2026, reflecting deteriorating technical indicators and persistent fundamental weaknesses despite some recent positive quarterly financial results. The company’s micro-cap status and ongoing challenges in profitability and debt servicing have contributed to this reassessment.
Read full news article
Raj Packaging Industries Ltd Upgraded to Hold on Technical and Financial Improvements
Raj Packaging Industries Ltd has seen its investment rating upgraded from Sell to Hold, reflecting a notable improvement in technical indicators and recent financial performance. The upgrade, effective from 22 June 2026, is driven by a combination of enhanced technical trends, attractive valuation metrics, positive quarterly financial results, and a cautiously optimistic financial trend, positioning the micro-cap packaging firm for a more stable outlook amid mixed long-term fundamentals.
Read full news article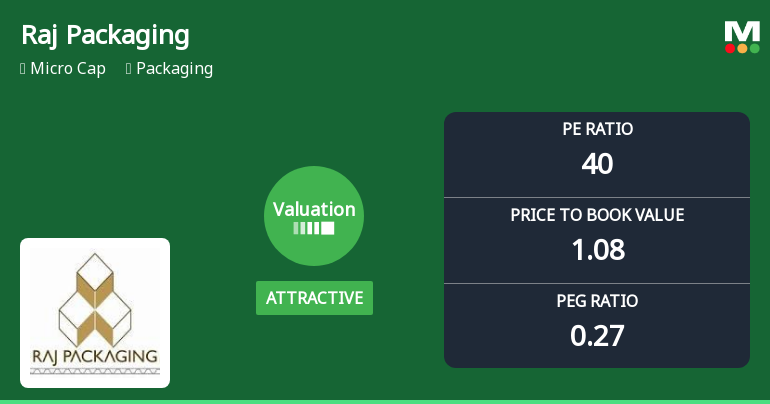
Raj Packaging Industries Ltd Valuation Shifts to Attractive Amid Mixed Returns
Raj Packaging Industries Ltd has recently seen a notable shift in its valuation parameters, moving from a very attractive to an attractive rating. Despite this positive change in price metrics such as the price-to-earnings (P/E) and price-to-book value (P/BV) ratios, the company’s stock performance remains mixed when compared to broader market benchmarks and industry peers. This article analyses the valuation changes in detail, placing them in the context of Raj Packaging’s financial health, peer comparisons, and recent market returns.
Read full news article Announcements
Compliances-Certificate under Reg. 74 (5) of SEBI (DP) Regulations 2018
09-Jul-2026 | Source : BSECertificate under Reg. 74(5) of SEBI (DP) Regulations 2018 for the quarter ended June 30 2026
Closure of Trading Window
26-Jun-2026 | Source : BSEIntimation of Closure of Trading Window
Audited Financial Results For March 31 2026
23-May-2026 | Source : BSEThe Board of directors of the company at their meeting held on 23.05.2026 inter alia considered and approved the audited financial results for the quarter and year ended March 31 2026
Corporate Actions

No Upcoming Board Meetings

Raj Packaging Industries Ltd has declared 5% dividend, ex-date: 16 Sep 21

No Splits history available

No Bonus history available

No Rights history available
Quality key factors
Valuation key factors
Technicals key factors
 Technical Indicator Scale: Bearish, Mildly Bearish, Sideways, Mildly Bullish, Bullish Turned
 Shareholding Snapshot : Jun 2026
Shareholding Compare (%holding)
Non Institution
None
Held by 0 Schemes
Held by 0 FIIs
Prem Kankaria . (13.74%)
Madanchand Prasanchand (10.97%)
59.34%
Quarterly Results Snapshot (Standalone) - Mar'26 - QoQ

QoQ Growth in quarter ended Mar 2026 is 7.24% vs -10.01% in Dec 2025
QoQ Growth in quarter ended Mar 2026 is 0.00% vs -100.00% in Dec 2025
Half Yearly Results Snapshot (Standalone) - Sep'25
Growth in half year ended Sep 2025 is 14.17% vs -2.13% in Sep 2024
Growth in half year ended Sep 2025 is 160.87% vs 68.06% in Sep 2024
Nine Monthly Results Snapshot (Standalone) - Dec'25
YoY Growth in nine months ended Dec 2025 is 10.53% vs -0.58% in Dec 2024
YoY Growth in nine months ended Dec 2025 is 125.00% vs 54.84% in Dec 2024
Annual Results Snapshot (Standalone) - Mar'26
YoY Growth in year ended Mar 2026 is 7.79% vs 1.20% in Mar 2025
YoY Growth in year ended Mar 2026 is 148.61% vs 49.30% in Mar 2025
About Raj Packaging Industries Ltd

Company Coordinates


