
Compare Rajasthan Securi with Similar Stocks
Dashboard
The company is Net-Debt Free
Healthy long term growth as Net Sales has grown by an annual rate of 6,121.00% and Operating profit at 3,380.00%
With a growth in Net Sales of INF%, the company declared Very Positive results in Mar 26
Majority shareholders : Non Institution
Consistent Returns over the last 3 years
Total Returns (Price + Dividend) 
Rajasthan Securi for the last several years.
Risk Adjusted Returns v/s
Returns Beta

News

Rajasthan Securities Ltd is Rated Buy
Rajasthan Securities Ltd is rated 'Buy' by MarketsMOJO, with this rating last updated on 01 June 2026. However, all fundamentals, returns, and financial metrics discussed here reflect the company’s current position as of 10 June 2026, providing investors with the most up-to-date analysis.
Read full news article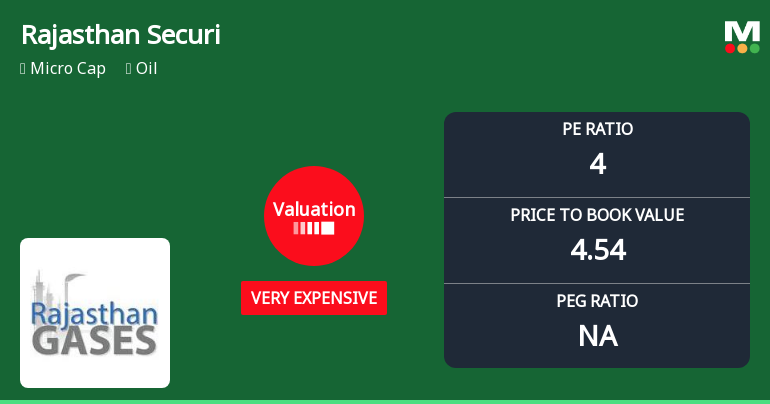
Rajasthan Securities Ltd Valuation Shifts Signal Price Attractiveness Concerns
Rajasthan Securities Ltd, a micro-cap player in the oil sector, has seen a significant shift in its valuation parameters, moving from a risky to a very expensive rating. Despite this, the company’s stock has delivered exceptional returns over multiple time horizons, outperforming the Sensex by a wide margin. This article analyses the recent valuation changes, compares them with peer averages, and assesses the implications for investors.
Read full news article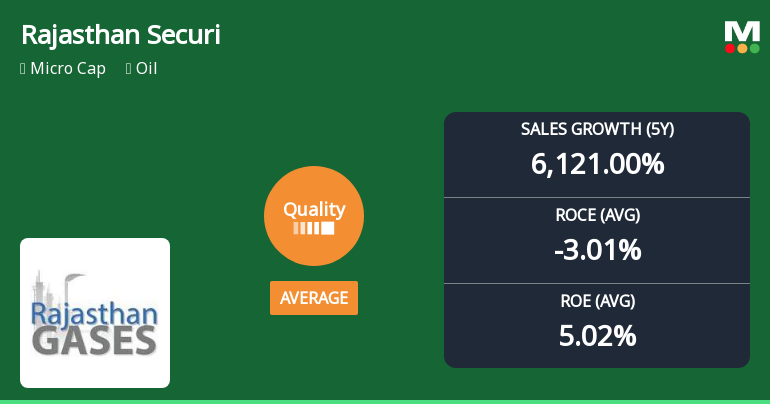
Rajasthan Securities Ltd Upgrades Quality Grade Amid Mixed Fundamental Signals
Rajasthan Securities Ltd, a micro-cap player in the oil sector, has seen its quality grade upgraded from "Does Not Qualify" to "Average" as of 4 November 2025. This shift reflects notable changes in the company’s business fundamentals, including its return ratios, debt profile, and growth metrics. While some parameters have improved significantly, others continue to pose challenges, leaving investors with a nuanced picture of the firm’s financial health and operational consistency.
Read full news article Announcements
Announcement under Regulation 30 (LODR)-Newspaper Publication
30-May-2026 | Source : BSEPursuant to Regulation 30 and Regulation 47 of the SEBI (Listing Obligations and Disclosure Requirements) Regulations 2015 we hereby enclose copies of the newspaper clipping published regarding of the Extract of Audited Financial Results for the Quarter and Financial Year ended 31st March 2026 in the following newspapers on 30th May 2026. a. Financial Express (English) b. Mahasagar (Marathi)
Compliances-Reg.24(A)-Annual Secretarial Compliance
30-May-2026 | Source : BSEWe enclose herewith a copy of Annual Secretarial Compliance Report for the year ended 31st March 2026 issued by Ms. Rupa Gupta Proprietor of M/s Gupta Rupa & Associates. Practising Company Secretaries (Membership No. F12465 and Peer review No. 12013WB1001500) Kolkata.
Audited Financial Results Of The Company For The Quarter And Year Ended On 31St March 2026.
28-May-2026 | Source : BSEIn continuation of our letter dated 20th May 2026 and pursuant to Regulation 33 of the SEBI ( Listing Obligations and Disclosure Requirements) Regulations 2015 we are enclosing the Audited Financial Results of the Company for the quarter and year ended on 31st March 2026 duly approved by the Board of Directors of the Company at their meeting held on Thursday 28th Day of May 2026 at 2.00 PM at the registered office of the company at Shop No.107 Plot no. 268 Honey Arjun Kauslya tower C.A Road Lakadganj Nagpur - 440008 Maharashtra India. The meeting of the Board of Directors of the Company commenced at 2:00 PM and concluded at 9:40 PM
Corporate Actions

No Upcoming Board Meetings

No Dividend history available

No Splits history available

No Bonus history available

No Rights history available
Quality key factors
Valuation key factors
Technicals key factors
 Technical Indicator Scale: Bearish, Mildly Bearish, Sideways, Mildly Bullish, Bullish Turned
 Shareholding Snapshot : Mar 2026
Shareholding Compare (%holding)
Non Institution
None
Held by 0 Schemes
Held by 0 FIIs
None
L7 Hitech Private Limited (12.05%)
84.41%
Quarterly Results Snapshot (Standalone) - Mar'26 - QoQ
QoQ Growth in quarter ended Mar 2026 is 0.00% vs 0.00% in Dec 2025

QoQ Growth in quarter ended Mar 2026 is 354.86% vs -170.06% in Dec 2025
Half Yearly Results Snapshot (Standalone) - Sep'25
Growth in half year ended Sep 2025 is 0.00% vs 0.00% in Sep 2024
Growth in half year ended Sep 2025 is 59,828.57% vs 58.82% in Sep 2024
Nine Monthly Results Snapshot (Standalone) - Dec'25
YoY Growth in nine months ended Dec 2025 is 0.00% vs 0.00% in Dec 2024

YoY Growth in nine months ended Dec 2025 is 181.07% vs 2,145.16% in Dec 2024
Annual Results Snapshot (Standalone) - Mar'26
YoY Growth in year ended Mar 2026 is 0.00% vs 0.00% in Mar 2025
YoY Growth in year ended Mar 2026 is 1,055.35% vs 1,502.00% in Mar 2025
About Rajasthan Securities Ltd

Company Coordinates


