
Compare Rajshree Sugars with Similar Stocks
Dashboard
High Debt company with Weak Long Term Fundamental Strength
- Poor long term growth as Net Sales has grown by an annual rate of 8.42% over the last 5 years
- High Debt Company with a Debt to Equity ratio (avg) of 13.31 times
- The company has been able to generate a Return on Equity (avg) of 3.09% signifying low profitability per unit of shareholders funds
100% of Promoter Shares are Pledged
Underperformed the market in the last 1 year
Total Returns (Price + Dividend) 
Latest dividend: 1.0000 per share ex-dividend date: Aug-16-2017
Risk Adjusted Returns v/s
Returns Beta

News
Rajshree Sugars & Chemicals Ltd is Rated Sell
Rajshree Sugars & Chemicals Ltd is rated 'Sell' by MarketsMOJO, with this rating last updated on 21 May 2026. However, the analysis and financial metrics discussed here reflect the stock's current position as of 16 June 2026, providing investors with an up-to-date view of the company’s fundamentals, valuation, financial trends, and technical outlook.
Read full news article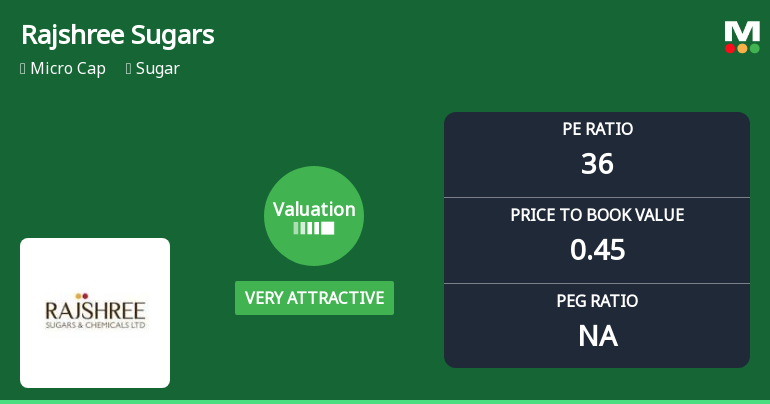
Rajshree Sugars & Chemicals Ltd: Valuation Shifts Signal Renewed Price Attractiveness
Rajshree Sugars & Chemicals Ltd has witnessed a notable shift in its valuation parameters, moving from an attractive to a very attractive rating, driven primarily by its compelling price-to-book value and price-to-earnings ratio metrics. Despite ongoing challenges reflected in its profitability ratios and stock performance relative to the Sensex, the sugar sector micro-cap is drawing renewed investor attention due to its improved valuation appeal.
Read full news article
Rajshree Sugars & Chemicals Ltd is Rated Sell
Rajshree Sugars & Chemicals Ltd is rated Sell by MarketsMOJO, with this rating last updated on 21 May 2026. However, the analysis and financial metrics discussed here reflect the stock's current position as of 02 June 2026, providing investors with the latest insights into the company’s performance and outlook.
Read full news article Announcements
Announcement under Regulation 30 (LODR)-Change in Management
17-Jun-2026 | Source : BSEAppointment of Mr. Madhan S as Senior Management Personnel - Head Human Resources
Announcement under Regulation 30 (LODR)-Monthly Business Updates
09-Jun-2026 | Source : BSEOperational data of our sugar factories for the month of May 2026
Compliances-Reg.24(A)-Annual Secretarial Compliance
30-May-2026 | Source : BSESubmission of Annual Secretarial Compliance Report for the year ended 31st March 2026.
Corporate Actions

No Upcoming Board Meetings

Rajshree Sugars & Chemicals Ltd has declared 30% dividend, ex-date: 15 Sep 10

No Splits history available

No Bonus history available

No Rights history available
Quality key factors
Valuation key factors
Technicals key factors
 Technical Indicator Scale: Bearish, Mildly Bearish, Sideways, Mildly Bullish, Bullish Turned
 Shareholding Snapshot : Mar 2026
Shareholding Compare (%holding)
Non Institution
100
Held by 4 Schemes (0.01%)
Held by 0 FIIs
Rajshree Pathy (34.21%)
Icici Bank Ltd (2.54%)
42.5%
Quarterly Results Snapshot (Standalone) - Mar'26 - QoQ

QoQ Growth in quarter ended Mar 2026 is 92.81% vs -16.13% in Dec 2025
QoQ Growth in quarter ended Mar 2026 is 444.29% vs -27.99% in Dec 2025
Half Yearly Results Snapshot (Standalone) - Sep'25

Growth in half year ended Sep 2025 is -33.24% vs -12.43% in Sep 2024
Growth in half year ended Sep 2025 is -227.89% vs -35.16% in Sep 2024
Nine Monthly Results Snapshot (Standalone) - Dec'25
YoY Growth in nine months ended Dec 2025 is -23.87% vs -19.11% in Dec 2024
YoY Growth in nine months ended Dec 2025 is -709.28% vs -84.80% in Dec 2024
Annual Results Snapshot (Standalone) - Mar'26
YoY Growth in year ended Mar 2026 is -15.14% vs -15.95% in Mar 2025
YoY Growth in year ended Mar 2026 is -85.91% vs -41.21% in Mar 2025
About Rajshree Sugars & Chemicals Ltd

Company Coordinates


