
Compare Rama Paper Mills with Similar Stocks
Dashboard
With a Negative Book Value, the company has a Weak Long Term Fundamental Strength
- Poor long term growth as Net Sales has grown by an annual rate of -56.10% and Operating profit at -195.45% over the last 5 years
- The company has a negative book value of Rs 45.01 crore
Flat results in Dec 25
Risky - Negative EBITDA
Stock DNA
Paper, Forest & Jute Products
INR 15 Cr (Micro Cap)
NA (Loss Making)
17
0.00%
-0.92
27.15%
-0.32
Total Returns (Price + Dividend) 
Latest dividend: 0.5000 per share ex-dividend date: Sep-10-2007
Risk Adjusted Returns v/s
Returns Beta

News
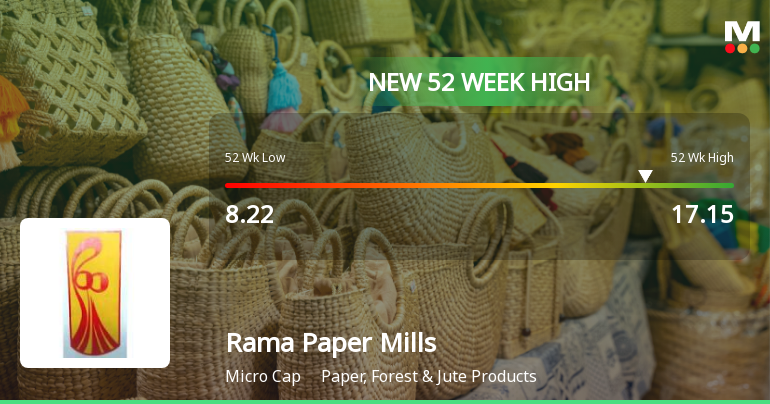
Broad-Based Technical Strength Lifts Rama Paper Mills Ltd to 52-Week High of Rs 17.15
Surging past its previous peaks, Rama Paper Mills Ltd touched a fresh 52-week high of Rs 17.15 on 10 Jun 2026, marking a notable milestone in its price momentum. This advance comes amid a three-day winning streak that has delivered a 12.65% return, outpacing its sector by 3.78% on the day.
Read full news articleWhen is the next results date for Rama Paper Mills Ltd?
The next results date for Rama Paper Mills Ltd is scheduled for 30 May 2026....
Read full news article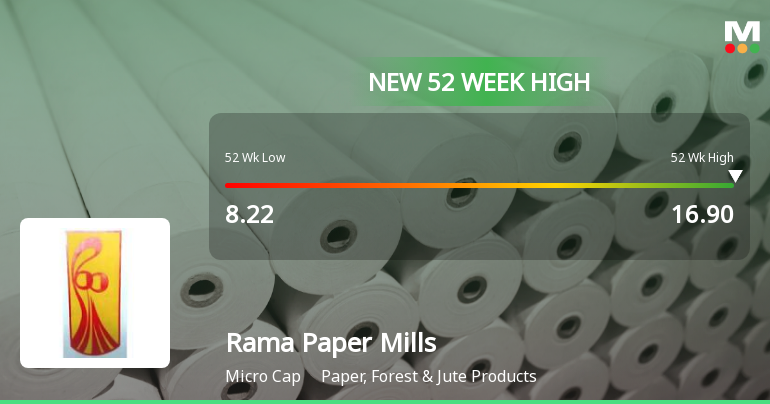
Broad-Based Technical Strength Lifts Rama Paper Mills Ltd to 52-Week High of Rs 16.9
Surging to a fresh 52-week high of Rs 16.9 on 20 May 2026, Rama Paper Mills Ltd has demonstrated robust price momentum, outperforming its sector by nearly 6% in a single session. This milestone caps a 22.91% gain over the past year, significantly outpacing the Sensex’s decline of 7.63% during the same period.
Read full news article Announcements
Board Meeting Intimation for Board Meeting Dated 30.05.2026
25-May-2026 | Source : BSERama Paper Mills Ltdhas informed BSE that the meeting of the Board of Directors of the Company is scheduled on 30/05/2026 inter alia to consider and approve Audited Financial Results for the period ending March 31 2026
Corporate Insolvency Resolution Process (CIRP)-Resolution Plans received by Resolution Professional
02-May-2026 | Source : BSEApproval of Resolution Plan of M/s Poddar Global Private Limited by the Committee of Creditors (CoC).
Compliances-Certificate under Reg. 74 (5) of SEBI (DP) Regulations 2018
15-Apr-2026 | Source : BSECertificate under Reg 74(5) of SEBI (DP) Regulations 2018 for the quarter ended on 31st March2026.
Corporate Actions

No Upcoming Board Meetings

Rama Paper Mills Ltd has declared 5% dividend, ex-date: 10 Sep 07

No Splits history available

No Bonus history available

No Rights history available
Quality key factors
Valuation key factors
Technicals key factors
 Technical Indicator Scale: Bearish, Mildly Bearish, Sideways, Mildly Bullish, Bullish Turned
 Shareholding Snapshot : Sep 2025
Shareholding Compare (%holding)
Non Institution
None
Held by 0 Schemes
Held by 0 FIIs
Ramfin Fortunes Private Limited (9.66%)
Pka Projects Private Limited (4.08%)
54.03%
Quarterly Results Snapshot (Standalone) - Dec'25 - QoQ

QoQ Growth in quarter ended Dec 2025 is -96.72% vs 916.67% in Sep 2025

QoQ Growth in quarter ended Dec 2025 is 47.91% vs -114.48% in Sep 2025
Half Yearly Results Snapshot (Standalone) - Sep'25
Growth in half year ended Sep 2025 is -79.77% vs -84.14% in Sep 2024
Growth in half year ended Sep 2025 is 59.45% vs 1.67% in Sep 2024
Nine Monthly Results Snapshot (Standalone) - Dec'25
YoY Growth in nine months ended Dec 2025 is -80.97% vs -83.69% in Dec 2024
YoY Growth in nine months ended Dec 2025 is 47.79% vs 30.57% in Dec 2024
Annual Results Snapshot (Standalone) - Mar'25
YoY Growth in year ended Mar 2025 is -88.27% vs -26.41% in Mar 2024
YoY Growth in year ended Mar 2025 is 15.61% vs -252.90% in Mar 2024
About Rama Paper Mills Ltd

Company Coordinates


