Ramchandra Leas.

  • Market Cap: Micro Cap
  • Industry: Non Banking Financial Company (NBFC)
  • ISIN: INE516P01015
  • NSEID:
  • BSEID: 538540
INR
9.30
-0.18 (-1.9%)
BSENSE

Feb 13

BSE+NSE Vol: 20.15 k

  • Price Points
  • Score
  • Mojo Parameters
  • Total Return
  • News and Corporate Actions
  • Key factors
  • Shareholding
  • Financials
  • CompanyCV
stock-recommendationUpcoming Result: Ramchandra Leas. will declare its result soon on 14 Feb 2026
stock-summaryPrice Point
High/Low

1Day

52 Week

Valuation
Technical
Day's Volume

CASH

20.15 k (-50.72%) Volume

Shareholding (Sep 2025)

FII

0.00%

Held by 0 FIIs

DII

0.01%

Held by 0 DIIs

Promoter

11.50%

What does Ramchandra Leas. do?

06-Jun-2025

Ramchandra Leasing and Finance Ltd is a Non Banking Financial Company (NBFC) based in Gujarat, operating in the micro-cap market segment with a market cap of Rs 15 Cr and reporting net sales and profit of 0 Cr as of March 2025. The company has a P/E ratio of 16.00 and a debt-equity ratio of 0.00%.

Overview:<BR>Ramchandra Leasing and Finance Ltd operates as a Non Banking Financial Company (NBFC) in the micro-cap market segment.<BR><BR>History:<BR>The company was incorporated on 2nd February, 1993, initially as Ramchandra Leasing and Finance Private Limited in Gujarat. It transitioned to a Public Limited Company on 3rd January 1996, receiving a fresh Certificate of Incorporation. The latest quarterly results report net sales and net profit of 0 Cr for the period ending March 2025.<BR><BR>Financial Snapshot:<BR>Most recent Net Sales: 0 Cr (Quarterly Results - Mar 2025) <BR>Most recent Net Profit: 0 Cr (Quarterly Results - Mar 2025) <BR>Market-cap value: Rs 15 Cr (Micro Cap)<BR><BR>Key Metrics:<BR>P/E: 16.00 <BR>Industry P/E: 23 <BR>Dividend Yield: 0.00% <BR>Debt-Equity: 0.00 <BR>Return on Equity: 0.18% <BR>Price-to-Book: 2.81 <BR><BR>Contact Details:<BR>Address: 201/1 Rudra Plaza, Dandia Bazar Main Road Vadodara Gujarat : 390001 <BR>Tel: 91-0265-3268100 <BR>Email: rlandfl@gmail.com <BR>Website: http://www.ramachandrafinance.com

View full answer

Has Ramchandra Leas. declared dividend?

06-Jun-2025

No Dividend History Available

What is the technical trend for Ramchandra Leas.?

09-Jun-2025

As of May 6, 2025, Ramchandra Leas shows a mildly bullish trend overall, supported by daily moving averages and the monthly MACD, despite mixed signals from the weekly MACD and Bollinger Bands indicating some bearishness.

As of 6 May 2025, the technical trend for Ramchandra Leas has changed from bullish to mildly bullish. The weekly MACD is mildly bearish, while the monthly MACD remains bullish, indicating mixed signals across time frames. The Bollinger Bands show a bearish stance on the weekly chart but a mildly bullish outlook on the monthly chart. Daily moving averages are mildly bullish, supporting a short-term positive view. The KST is mildly bearish on the weekly and bullish on the monthly, further contributing to the mixed sentiment. Overall, the current technical stance is mildly bullish, driven primarily by the daily moving averages and the monthly MACD, despite the bearish indicators on the weekly charts.

View full answer

Who are the peers of the Ramchandra Leas.?

16-Jul-2025

Peers of Ramchandra Leas. include Shree Securities, Cil Securities, Stellant Secu., Rita Finance, Easun Capital Ma, Abirami Fin., Bharat Bhushan, Shree Metalloys, and G K Consultants. Notably, Stellant Secu. has the highest 1-year return at 1256.59%, while Ramchandra Leas. has a return of 252.90%.

Peers: The peers of Ramchandra Leas. are Shree Securities, Cil Securities, Stellant Secu., Rita Finance and, Easun Capital Ma, Abirami Fin., Bharat Bhushan, Shree Metalloys, and G K Consultants.<BR><BR>Quality Snapshot: Excellent capital structure is observed at Cil Securities, Rita Finance and, Easun Capital Ma, and G K Consultants, while Below Average management risk is found at Cil Securities, Rita Finance and, Easun Capital Ma, Shree Metalloys, and G K Consultants, and the rest. Management risk that does not qualify is noted at Shree Securities, Ramchandra Leas., Stellant Secu., Abirami Fin., and Bharat Bhushan. Growth ratings show Good growth at Cil Securities, while Below Average growth is seen at Rita Finance and, Easun Capital Ma, Shree Metalloys, G K Consultants, and the rest.<BR><BR>Return Snapshot: The peer with the highest 1-year return is Stellant Secu. at 1256.59%, while the lowest is Abirami Fin. at -28.69%. Ramchandra Leas. has a significantly higher 1-year return of 252.90%. Additionally, peers with negative six-month returns include Cil Securities, Easun Capital Ma, Abirami Fin., Bharat Bhushan, and Shree Metalloys.

View full answer

Who are in the management team of Ramchandra Leas.?

16-Jul-2025

As of March 2018, the management team of Ramchandra Leas includes Pradeep Saremal Jain (Whole Time Director), Kishor Kumar (Non Executive Director), Champa Bhatia (Non Executive Independent Director), and Bharat Sen (Non Executive Independent Director).

As of March 2018, the management team of Ramchandra Leas consists of the following individuals:<BR><BR>1. Pradeep Saremal Jain - Whole Time Director<BR>2. Kishor Kumar - Non Executive Director<BR>3. Champa Bhatia - Non Executive Independent Director<BR>4. Bharat Sen - Non Executive Independent Director<BR><BR>These members play various roles within the company's governance structure.

View full answer

Who are the top shareholders of the Ramchandra Leas.?

17-Jul-2025

The top shareholders of Ramchandra Leas are primarily individual investors, holding 68.82% of the shares, with Dipeshkumar Ravjibhai Patel as the largest promoter at 2.17%. There are no pledged promoter holdings, mutual funds, or foreign institutional investors involved.

The top shareholders of Ramchandra Leas primarily consist of individual investors, who hold a significant 68.82% of the shares. The promoter with the highest holding is Dipeshkumar Ravjibhai Patel, who owns 2.17% of the company. There are no pledged promoter holdings, and the company does not have any mutual funds or foreign institutional investors holding shares. Overall, the majority of the shares are held by non-institutional investors.

View full answer

How big is Ramchandra Leas.?

24-Jul-2025

As of 24th July, Ramchandra Leasing and Finance Ltd has a market capitalization of 21.00 Cr and reported Net Sales of 0.26 Cr with no profit in the latest two quarters. Shareholder's Funds were 5.52 Cr and Total Assets were 7.06 Cr.

As of 24th July, Ramchandra Leasing and Finance Ltd has a market capitalization of 21.00 Cr, classified as a Micro Cap.<BR><BR>In the latest two quarters, the company reported Net Sales of 0.26 Cr and a Net Profit of 0.00 Cr, indicating no profit during this period.<BR><BR>For the latest annual period, the Shareholder's Funds were recorded at 5.52 Cr, while Total Assets amounted to 7.06 Cr.

View full answer

When is the next results date for Ramchandra Leas.?

07-Nov-2025

Ramchandra Leas. will announce its results on 14 November 2025.

Ramchandra Leas. will declare its results on 14 November 2025.

View full answer

How has been the historical performance of Ramchandra Leas.?

17-Nov-2025

Ramchandra Leas has seen a decline in net sales and total operating income from 0.62 Cr in Mar'20 to 0.38 Cr in Mar'25, while total expenditure also decreased, indicating cost management. Operating profit remained stable, with profit after tax at 0.02 Cr in Mar'25, and cash balances improved from 0.01 Cr to 0.17 Cr, reflecting better liquidity.

Answer:<BR>The historical performance of Ramchandra Leas shows a declining trend in net sales and total operating income over the years, with figures decreasing from 0.62 Cr in Mar'20 to 0.38 Cr in Mar'25. The total expenditure has also decreased from 0.58 Cr in Mar'20 to 0.36 Cr in Mar'25, indicating a reduction in costs. Operating profit (PBDIT) has remained relatively stable, fluctuating slightly but ending at 0.02 Cr in Mar'25, the same as in Mar'24 and Mar'23. Profit after tax has shown slight improvement, reaching 0.02 Cr in Mar'25, consistent with the previous year, but lower than 0.06 Cr in Mar'19. The company has maintained a consistent equity capital of 5.12 Cr over the years, while reserves have increased from 0.29 Cr in Mar'19 to 0.50 Cr in Mar'25. The total liabilities have decreased from 6.94 Cr in Mar'20 to 6.38 Cr in Mar'25, and total assets have followed a similar trend, decreasing from 6.94 Cr in Mar'20 to 6.38 Cr in Mar'25. Cash and bank balances have improved slightly from 0.01 Cr in Mar'20 to 0.17 Cr in Mar'25, reflecting a modest increase in liquidity.<BR><BR>Breakdown:<BR>Ramchandra Leas has experienced a decline in net sales from 0.62 Cr in Mar'20 to 0.38 Cr in Mar'25, indicating a downward trend in revenue generation. Total operating income has mirrored this decline, dropping from 0.62 Cr to 0.38 Cr over the same period. Despite the decrease in sales, total expenditure has also reduced from 0.58 Cr to 0.36 Cr, suggesting cost management efforts. Operating profit has remained relatively stable, with a slight increase in profit after tax to 0.02 Cr in Mar'25, consistent with the previous two years. The company's equity capital has remained unchanged at 5.12 Cr, while reserves have grown to 0.50 Cr, reflecting a strengthening of the financial position. Total liabilities and assets have both decreased, indicating a contraction in the balance sheet, with total liabilities falling to 6.38 Cr and total assets to 6.38 Cr by Mar'25. Cash and bank balances have improved, suggesting enhanced liquidity, rising from 0.01 Cr in Mar'20 to 0.17 Cr in Mar'25.

View full answer

Is Ramchandra Leas. overvalued or undervalued?

20-Nov-2025

As of November 19, 2025, Ramchandra Leas. is considered very expensive with a PE ratio of 349.48 and a PEG ratio of 0.29, indicating it is overvalued compared to peers like Bajaj Finance and Life Insurance, despite a 320.85% return over the past year.

As of 19 November 2025, the valuation grade for Ramchandra Leas. has moved from expensive to very expensive. The company is currently overvalued, with a PE ratio of 349.48, an EV to EBIT of 43.11, and a ROE of just 1.04%. These metrics indicate a significant premium over its peers, such as Bajaj Finance, which has a PE ratio of 34.23, and Life Insurance, with a PE of 11.32.<BR><BR>In comparison to its industry, Ramchandra Leas. stands out with its exceptionally high valuation ratios, making it very expensive relative to its peers. The PEG ratio of 0.29 suggests that despite the high price, growth expectations may not justify the valuation. Additionally, while the stock has significantly outperformed the Sensex in recent periods, including a staggering 320.85% return over the past year, this performance does not align with the fundamental valuation metrics, reinforcing the conclusion that the company is overvalued.

View full answer

Which are the latest news on Ramchandra Leas.?

13-Feb-2026

Why is Ramchandra Leasing and Finance Ltd falling/rising?

14-Feb-2026

As of 13-Feb, the stock price of Ramchandra Leasing and Finance Ltd is declining, currently at 9.30, reflecting a decrease of 1.9% after a trend reversal. Investor participation is decreasing, and while the stock is above some moving averages, it is below others, indicating potential weakening momentum.

As of 13-Feb, the stock price of Ramchandra Leasing and Finance Ltd is falling, currently at 9.30, which reflects a decrease of 0.18 or 1.9%. This decline comes after a trend reversal, as the stock has fallen following three consecutive days of gains. Additionally, the stock has underperformed its sector by 0.67% today.<BR><BR>Investor participation appears to be decreasing, with the delivery volume on 12 February dropping by 22.37% compared to the 5-day average. Although the stock's current price is higher than the 5-day, 100-day, and 200-day moving averages, it remains lower than the 20-day and 50-day moving averages, indicating a potential weakening momentum. <BR><BR>Overall, these factors contribute to the current downward movement in the stock price of Ramchandra Leasing and Finance Ltd.

View full answer
iScoreScore
Click here to find our call on this stock
Strong Sell
Sell
Hold
Buy
Strong Buy

Dashboard

Icon
Unrated Stock - No Analysis Available
stock-summaryMojo Parameters

Mojo Parameters

Loading Valuation Snapshot...

Stock DNA

stock-summary
Industry

Non Banking Financial Company (NBFC)

stock-summary
Market cap

INR 77 Cr (Micro Cap)

stock-summary
P/E

581.00

stock-summary
Industry P/E

23

stock-summary
Dividend Yield

0.00%

stock-summary
Debt Equity

0.00

stock-summary
Return on Equity

1.04%

stock-summary
Price to Book

6.15

Revenue and Profits:
Net Sales:
0 Cr
(Quarterly Results - Sep 2025)
Net Profit:
0 Cr
stock-summaryTotal Returns
Total Returns (Price + Dividend) stock-summary
Dividend Yield (0%)
TimePeriod
Price Return
Dividend Return
Total Return
3 Months
13.14%
0%
13.14%
6 Months
87.12%
0%
87.12%
1 Year
210.0%
0%
210.0%
2 Years
811.76%
0%
811.76%
3 Years
820.79%
0%
820.79%
4 Years
0%
0%
0.0%
5 Years
3000.0%
0%
3000.0%

Ramchandra Leas. for the last several years.

Risk Adjusted Returns v/s stock-summary
Returns Beta
Icon
Beta has not been calculated since enough price history is not available
stock-summaryNews & Corporate Actions

News

Why is Ramchandra Leas. falling/rising?

Recent Price Movement and Market Context

Despite the current dip, Ramchandra Leasing and Finance Ltd has delivered exceptional returns over the longer term. The stock has surged by an impressive 240.9% over the past year, vastly outperforming the Sensex’s 7.2% gain during the same period. Over five years, the stock’s growth has been even more remarkable, rising by over 3,030%, compared to the benchmark’s 80.9% increase. This extraordinary performance underscores the company’s strong fundamentals and investor confidence in its business model.

However, the recent one-week performance tells a different story. The stock has declined by 9.4%, significantly underperforming the Sensex, which was down just 0.4% in the same timeframe. This sharp short-term fall suggests profit-...

Read full news article
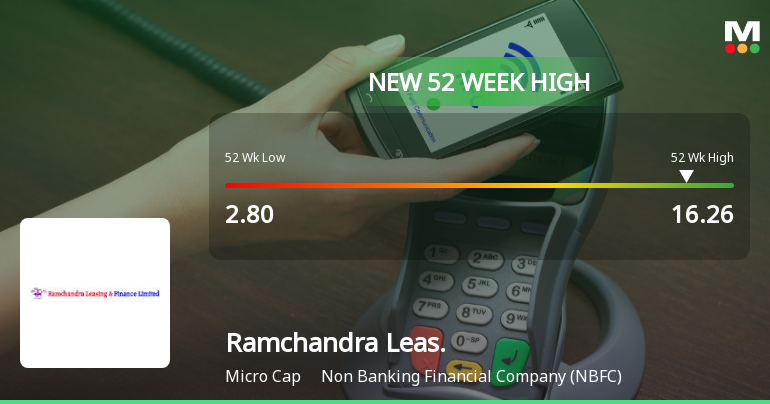
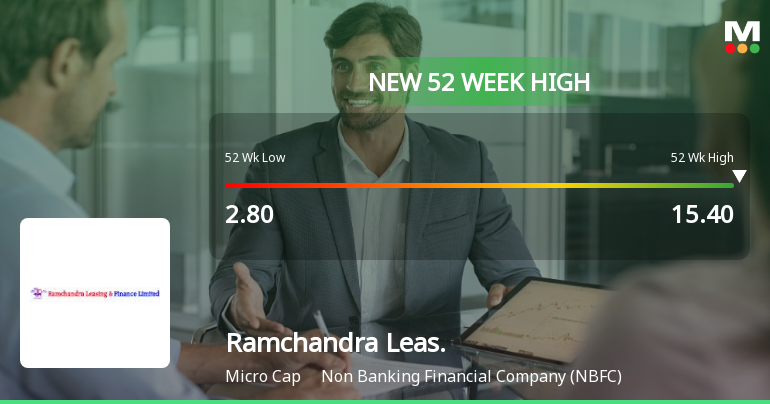
Announcements stock-summary

Disclosure Under Regulation 30 Of SEBI (LODR) Regulations 2015 - Correction In Explanatory Statement Of EGM Held On November 21 2025

09-Feb-2026 | Source : BSE

CORRECTION IN EXPLANATORY STATEMENT OF NOTICE OF EXTRA- ORDINARY GENERAL MEETING HELD ON NOVEMBER 21 2025.

Board Meeting Intimation for Intimation Of Board Meeting Under Regulation 29 Of SEBI (Listing Obligations And Disclosure Requirements) Regulations 2015

08-Feb-2026 | Source : BSE

Ramchandra Leasing & Finance Ltdhas informed BSE that the meeting of the Board of Directors of the Company is scheduled on 14/02/2026 inter alia to consider and approve Dear Sir/Madam Pursuant to Regulation 29 of the SEBI (Listing Obligations and Disclosure Requirements) Regulations 2015 we wish to inform you that a meeting of the Board of Directors of the Company is scheduled to be held on Saturday February 14 2026 inter alia: a. To consider and approve the Unaudited Financial Results of the Company for the quarter and Nine months ended December 31 2025 b. To take note of the Limited Review Report for the quarter and Nine months ended December 31 2025 c. To take note of the resignation/appointment of Directors. d. Other matters as may deem fit by the Board Kindly take the same on record.

Announcement under Regulation 30 (LODR)-Resignation of Director

06-Feb-2026 | Source : BSE

Intimation for resignation of Independent Director

Corporate Actions stock-summary

stock-summary
BOARD MEETING

(14 Feb 2026)

stock-summary
DIVIDEND

No Dividend history available

stock-summary
SPLITS

No Splits history available

stock-summary
BONUS

No Bonus history available

stock-summary
RIGHTS

No Rights history available

stock-summaryKey Factors

Quality key factors stock-summary

Factor
Value
Sales Growth (5y)
-0.20%
EBIT Growth (5y)
3.19%
Net Debt to Equity (avg)
0
Institutional Holding
0.00%
ROE (avg)
0

Valuation key factors

Factor
Value
P/E Ratio
581
Industry P/E
23
Price to Book Value
6.03
EV to EBIT
73.16
EV to EBITDA
73.16
EV to Capital Employed
7.17
EV to Sales
73.16
PEG Ratio
0.81
Dividend Yield
NA
ROCE (Latest)
1.76%
ROE (Latest)
1.04%

Technicals key factors

Indicator
Weekly
Monthly
MACD
Mildly Bearish
Bullish
RSI
No Signal
Bearish
Bollinger Bands
Bullish
Mildly Bullish
Moving Averages
Mildly Bullish (Daily)
KST
Mildly Bearish
Bullish
Dow Theory
No Trend
No Trend
stock-summary Technical Indicator Scale: Bearish, Mildly Bearish, Sideways, Mildly Bullish, Bullish  Turned 
stock-summaryShareholding
Shareholding Snapshot : Sep 2025stock-summary
Shareholding Compare (%holding) stock-summary
Majority shareholders

Non Institution

Pledged Promoter Holdings

None

Mutual Funds

Held by 0 Schemes

FIIs

Held by 0 FIIs

Promoter with highest holding

Pratika Sharma (25.13%)

Highest Public shareholder

Sudhanshu Kanda (1.02%)

Individual Investors Holdings

66.99%

stock-summaryFinancial
[
  {
    "link": "quarterly",
    "btn_text": "All Quarterly Results",
    "header": "Quarterly Results Snapshot (Standalone) - Sep'25 - YoY",
    "rhs": [
      {
        "prefix": "Net Sales ",
        "suffix": "YoY Growth in quarter ended Sep 2025 is 142.86% vs 600.00% in Sep 2024",
        "dir": -1
      },
      {
        "prefix": "Standalone Net Profit ",
        "suffix": "YoY Growth in quarter ended Sep 2025 is 0.00% vs 0.00% in Sep 2024",
        "dir": 0
      }
    ],
    "table": {
      "header": [
        "Sep'25",
        "Sep'24",
        "Change(%)"
      ],
      "body": [
        {
          "field": "Net Sales",
          "val1": "0.17",
          "val2": "0.07",
          "chgp": "142.86%",
          "chgp_class": "positive"
        },
        {
          "field": "Operating Profit (PBDIT) excl Other Income",
          "val1": "0.16",
          "val2": "0.00",
          "chgp": "",
          "chgp_class": "neutral"
        },
        {
          "field": "Interest",
          "val1": "0.00",
          "val2": "0.00",
          "chgp": "",
          "chgp_class": "neutral"
        },
        {
          "field": "Exceptional Items",
          "val1": "0.00",
          "val2": "0.00",
          "chgp": "",
          "chgp_class": "neutral"
        },
        {
          "field": "Standalone Net Profit",
          "val1": "0.12",
          "val2": "0.00",
          "chgp": "",
          "chgp_class": "neutral"
        },
        {
          "field": "Operating Profit Margin (Excl OI)",
          "val1": "94.12%",
          "val2": "0.00%",
          "chgp": "94.12%",
          "chgp_class": "positive"
        }
      ]
    }
  },
  {
    "link": "half-yearly",
    "btn_text": "All Half Yearly Results",
    "header": "Half Yearly Results Snapshot (Standalone) - Sep'25",
    "rhs": [
      {
        "prefix": "Net Sales ",
        "suffix": " Growth in half year ended Sep 2025 is 88.89% vs 350.00% in Sep 2024",
        "dir": -1
      },
      {
        "prefix": "Standalone Net Profit ",
        "suffix": " Growth in half year ended Sep 2025 is 0.00% vs 0.00% in Sep 2024",
        "dir": 0
      }
    ],
    "table": {
      "header": [
        "Sep'25",
        "Sep'24",
        "Change(%)"
      ],
      "body": [
        {
          "field": "Net Sales",
          "val1": "0.34",
          "val2": "0.18",
          "chgp": "88.89%",
          "chgp_class": "positive"
        },
        {
          "field": "Operating Profit (PBDIT) excl Other Income",
          "val1": "0.17",
          "val2": "0.00",
          "chgp": "",
          "chgp_class": "neutral"
        },
        {
          "field": "Interest",
          "val1": "0.00",
          "val2": "0.00",
          "chgp": "",
          "chgp_class": "neutral"
        },
        {
          "field": "Exceptional Items",
          "val1": "0.00",
          "val2": "0.00",
          "chgp": "",
          "chgp_class": "neutral"
        },
        {
          "field": "Standalone Net Profit",
          "val1": "0.12",
          "val2": "0.00",
          "chgp": "",
          "chgp_class": "neutral"
        },
        {
          "field": "Operating Profit Margin (Excl OI)",
          "val1": "50.00%",
          "val2": "0.00%",
          "chgp": "50.00%",
          "chgp_class": "positive"
        }
      ]
    }
  },
  {
    "link": "nine-monthly",
    "btn_text": "All Nine Monthly Results",
    "header": "Nine Monthly Results Snapshot (Standalone) - Dec'24",
    "rhs": [
      {
        "prefix": "Net Sales ",
        "suffix": "YoY Growth in nine months ended Dec 2024 is 240.00% vs 11.11% in Dec 2023",
        "dir": 1
      },
      {
        "prefix": "Standalone Net Profit ",
        "suffix": "YoY Growth in nine months ended Dec 2024 is 0.00% vs 0.00% in Dec 2023",
        "dir": 0
      }
    ],
    "table": {
      "header": [
        "Dec'24",
        "Dec'23",
        "Change(%)"
      ],
      "body": [
        {
          "field": "Net Sales",
          "val1": "0.34",
          "val2": "0.10",
          "chgp": "240.00%",
          "chgp_class": "positive"
        },
        {
          "field": "Operating Profit (PBDIT) excl Other Income",
          "val1": "0.00",
          "val2": "0.00",
          "chgp": "",
          "chgp_class": "neutral"
        },
        {
          "field": "Interest",
          "val1": "0.00",
          "val2": "0.00",
          "chgp": "",
          "chgp_class": "neutral"
        },
        {
          "field": "Exceptional Items",
          "val1": "0.00",
          "val2": "0.00",
          "chgp": "",
          "chgp_class": "neutral"
        },
        {
          "field": "Standalone Net Profit",
          "val1": "0.00",
          "val2": "0.00",
          "chgp": "",
          "chgp_class": "neutral"
        },
        {
          "field": "Operating Profit Margin (Excl OI)",
          "val1": "0.00%",
          "val2": "0.00%",
          "chgp": "NA",
          "chgp_class": "neutral"
        }
      ]
    }
  },
  {
    "link": "annual",
    "btn_text": "All Annual Results",
    "header": "Annual Results Snapshot (Consolidated) - Mar'25",
    "rhs": [
      {
        "prefix": "Net Sales ",
        "suffix": "YoY Growth in year ended Mar 2025 is -17.39% vs -2.13% in Mar 2024",
        "dir": -1
      },
      {
        "prefix": "Consolidated Net Profit ",
        "suffix": "YoY Growth in year ended Mar 2025 is -50.00% vs 100.00% in Mar 2024",
        "dir": -1
      }
    ],
    "table": {
      "header": [
        "Mar'25",
        "Mar'24",
        "Change(%)"
      ],
      "body": [
        {
          "field": "Net Sales",
          "val1": "0.38",
          "val2": "0.46",
          "chgp": "-17.39%",
          "chgp_class": "negative"
        },
        {
          "field": "Operating Profit (PBDIT) excl Other Income",
          "val1": "0.02",
          "val2": "0.02",
          "chgp": "",
          "chgp_class": "neutral"
        },
        {
          "field": "Interest",
          "val1": "0.00",
          "val2": "0.00",
          "chgp": "",
          "chgp_class": "neutral"
        },
        {
          "field": "Exceptional Items",
          "val1": "0.00",
          "val2": "0.00",
          "chgp": "",
          "chgp_class": "neutral"
        },
        {
          "field": "Consolidate Net Profit",
          "val1": "0.01",
          "val2": "0.02",
          "chgp": "-50.00%",
          "chgp_class": "negative"
        },
        {
          "field": "Operating Profit Margin (Excl OI)",
          "val1": "4.25%",
          "val2": "3.80%",
          "chgp": "0.45%",
          "chgp_class": "positive"
        }
      ]
    }
  }
]

Quarterly Results Snapshot (Standalone) - Sep'25 - YoYstock-summary

Sep'25
Sep'24
Change(%)
Net Sales
0.17
0.07
142.86%
Operating Profit (PBDIT) excl Other Income
0.16
0.00
Interest
0.00
0.00
Exceptional Items
0.00
0.00
Standalone Net Profit
0.12
0.00
Operating Profit Margin (Excl OI)
94.12%
0.00%
94.12%
Values in Rs Cr.
Direction Arrows
Net Sales

YoY Growth in quarter ended Sep 2025 is 142.86% vs 600.00% in Sep 2024

Standalone Net Profit

YoY Growth in quarter ended Sep 2025 is 0.00% vs 0.00% in Sep 2024

Half Yearly Results Snapshot (Standalone) - Sep'25stock-summary

Sep'25
Sep'24
Change(%)
Net Sales
0.34
0.18
88.89%
Operating Profit (PBDIT) excl Other Income
0.17
0.00
Interest
0.00
0.00
Exceptional Items
0.00
0.00
Standalone Net Profit
0.12
0.00
Operating Profit Margin (Excl OI)
50.00%
0.00%
50.00%
Values in Rs Cr.
Direction Arrows
Net Sales

Growth in half year ended Sep 2025 is 88.89% vs 350.00% in Sep 2024

Standalone Net Profit

Growth in half year ended Sep 2025 is 0.00% vs 0.00% in Sep 2024

Nine Monthly Results Snapshot (Standalone) - Dec'24stock-summary

Dec'24
Dec'23
Change(%)
Net Sales
0.34
0.10
240.00%
Operating Profit (PBDIT) excl Other Income
0.00
0.00
Interest
0.00
0.00
Exceptional Items
0.00
0.00
Standalone Net Profit
0.00
0.00
Operating Profit Margin (Excl OI)
0.00%
0.00%
NA
Values in Rs Cr.
Direction Arrows
Net Sales

YoY Growth in nine months ended Dec 2024 is 240.00% vs 11.11% in Dec 2023

Standalone Net Profit

YoY Growth in nine months ended Dec 2024 is 0.00% vs 0.00% in Dec 2023

Annual Results Snapshot (Consolidated) - Mar'25stock-summary

Mar'25
Mar'24
Change(%)
Net Sales
0.38
0.46
-17.39%
Operating Profit (PBDIT) excl Other Income
0.02
0.02
Interest
0.00
0.00
Exceptional Items
0.00
0.00
Consolidate Net Profit
0.01
0.02
-50.00%
Operating Profit Margin (Excl OI)
4.25%
3.80%
0.45%
Values in Rs Cr.
Direction Arrows
Net Sales

YoY Growth in year ended Mar 2025 is -17.39% vs -2.13% in Mar 2024

Direction Arrows
Consolidated Net Profit

YoY Growth in year ended Mar 2025 is -50.00% vs 100.00% in Mar 2024

stock-summaryCompany CV
About Ramchandra Leasing and Finance Ltd stock-summary
stock-summary
Ramchandra Leasing and Finance Ltd
Micro Cap
Non Banking Financial Company (NBFC)
Ramchandra Leasing and Finance Ltd (RLFL), was incorporated on 2nd February, 1993 as Ramchandra Leasing and Finance Private Limited at Gujarat. On 3rd January 1996, the Company was converted into Public Limited Company and obtained a fresh Certificate of Incorporation from the Registrar of the Companies.
Company Coordinates stock-summary
Company Details
201/1 Rudra Plaza, Dandia Bazar Main Road Vadodara Gujarat : 390001
stock-summary
Tel: 91-0265-3268100
stock-summary
rlandfl@gmail.com
Registrar Details
Purva Shareregistry (India) Pvt Ltd , Gala No 9, Shiv Shakti, Industrial Estate,Sitaram Mill Comp., J R Boricha Marg, Lower Parel [E], Mumbai