
Compare Rander Corpn. with Similar Stocks
Dashboard
With a Operating Losses, the company has a Weak Long Term Fundamental Strength
- Company's ability to service its debt is weak with a poor EBIT to Interest (avg) ratio of 0.56
- The company has been able to generate a Return on Equity (avg) of 2.58% signifying low profitability per unit of shareholders funds
- PAT(Q) At Rs -1.99 cr has Fallen at -11271.4% (vs previous 4Q average)
- PBDIT(Q) Lowest at Rs -2.42 cr.
- PBT LESS OI(Q) Lowest at Rs -2.67 cr.
Risky - Negative EBITDA
Stock DNA
Non Banking Financial Company (NBFC)
INR 12 Cr (Micro Cap)
NA (Loss Making)
33
0.00%
-0.02
-6.08%
0.51
Total Returns (Price + Dividend) 
Latest dividend: 0.6999999999999998 per share ex-dividend date: Aug-28-2013
Risk Adjusted Returns v/s
Returns Beta

News
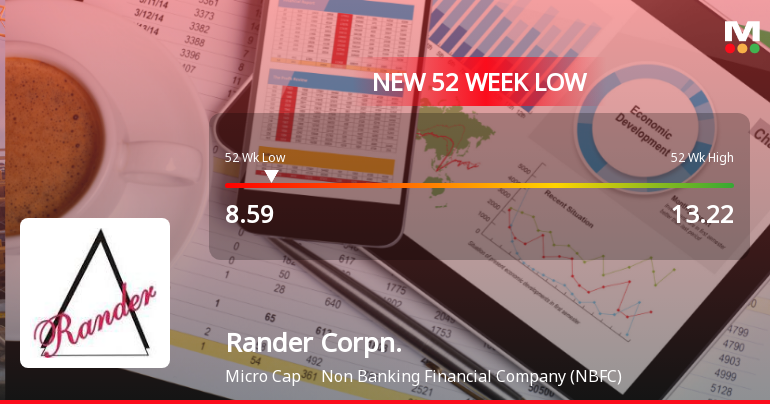

Five Consecutive Losses Push Rander Corporation Ltd to a New 52-Week Low
For the fifth consecutive session, Rander Corporation Ltd has closed lower, slipping to a fresh 52-week low of Rs 8.76 on 3 Jun 2026. This decline extends the stock’s losing streak to -7.5% over four days, underscoring persistent selling pressure despite the broader market’s own struggles.
Read full news article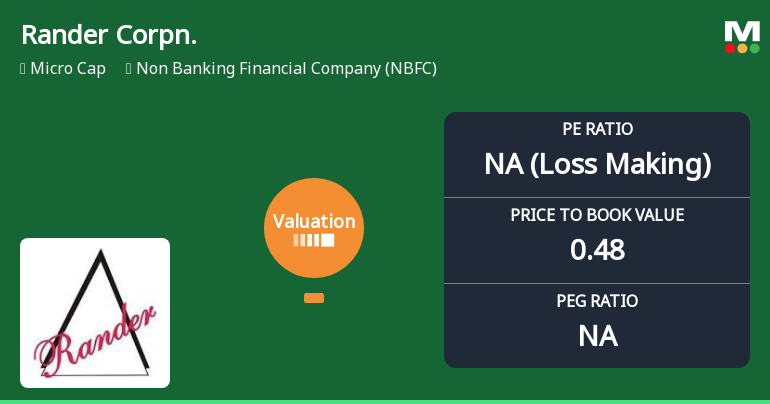
Rander Corporation Ltd Faces Valuation Reassessment Amid Deteriorating Metrics
Rander Corporation Ltd, a micro-cap player in the Non Banking Financial Company (NBFC) sector, has seen its valuation parameters deteriorate sharply, shifting from a 'very expensive' to a 'risky' classification. This change, coupled with weak financial metrics and underperformance relative to benchmarks, raises significant concerns about the stock’s price attractiveness and investment viability.
Read full news article Announcements
Board Meeting Outcome for Outcome Of The Board Meeting Held On Saturday May 30 2026 Pursuant To Regulation 30 Of SEBI (Listing Obligations & Disclosure Requirements) Regulations 2015
30-May-2026 | Source : BSEBoard of Directors of the Company at its Meeting held today i.e. Saturday May 30 2026 has considered and approved the following: 1. Audited Financial Statements including Balance Sheet as at March 31 2026 Statement of Profit and Loss Cash Flow Statement and Notes thereon for the financial year ended March 31 2026 together with the Auditors Report thereon and Audited Financial Results for the quarter and financial year ended March 31 2026.
Audited Financial Results For The Quarter And Year Ended March 31 2026
30-May-2026 | Source : BSEAudited Financial Results (Standalone) for the quarter and year ended March 31 2026
Compliances-Reg.24(A)-Annual Secretarial Compliance
27-May-2026 | Source : BSEAnnual Secretarial Compliance Report for the Financial year ended March 31 2026
Corporate Actions

No Upcoming Board Meetings

Rander Corporation Ltd has declared 7% dividend, ex-date: 28 Aug 13

Rander Corporation Ltd has announced 10:1 stock split, ex-date: 26 Nov 15

No Bonus history available

No Rights history available
Quality key factors
Valuation key factors
Technicals key factors
 Technical Indicator Scale: Bearish, Mildly Bearish, Sideways, Mildly Bullish, Bullish Turned
 Shareholding Snapshot : Mar 2026
Shareholding Compare (%holding)
Non Institution
None
Held by 0 Schemes
Held by 0 FIIs
Amarchand Ratanlal Rander (5.0%)
Gulistan Vanijya Pvt. Ltd. (3.94%)
30.95%
Quarterly Results Snapshot (Standalone) - Mar'26 - QoQ

QoQ Growth in quarter ended Mar 2026 is -13.24% vs 91.55% in Dec 2025
QoQ Growth in quarter ended Mar 2026 is -637.84% vs 362.50% in Dec 2025
Half Yearly Results Snapshot (Standalone) - Sep'25

Growth in half year ended Sep 2025 is 328.57% vs -42.47% in Sep 2024
Growth in half year ended Sep 2025 is 64.29% vs -46.15% in Sep 2024
Nine Monthly Results Snapshot (Standalone) - Dec'25
YoY Growth in nine months ended Dec 2025 is 192.59% vs -40.33% in Dec 2024
YoY Growth in nine months ended Dec 2025 is 400.00% vs -84.81% in Dec 2024
Annual Results Snapshot (Standalone) - Mar'26
YoY Growth in year ended Mar 2026 is 206.38% vs -64.66% in Mar 2025
YoY Growth in year ended Mar 2026 is -166.67% vs -129.03% in Mar 2025
About Rander Corporation Ltd

Company Coordinates


