
Compare Rapicut Carbides with Similar Stocks
Dashboard
Weak Long Term Fundamental Strength with an average Return on Capital Employed (ROCE) of 0.32%
- Company's ability to service its debt is weak with a poor EBIT to Interest (avg) ratio of 0.09
With a growth in Net Sales of 137.3%, the company declared Very Positive results in Mar 26
With ROCE of -1.8, it has a Very Expensive valuation with a 5.6 Enterprise value to Capital Employed
Majority shareholders : Non Institution
Market Beating performance in long term as well as near term
Stock DNA
Industrial Manufacturing
INR 137 Cr (Micro Cap)
67.00
36
0.00%
0.32
10.61%
7.11
Total Returns (Price + Dividend) 
Latest dividend: 1.5 per share ex-dividend date: Sep-19-2019
Risk Adjusted Returns v/s
Returns Beta

News
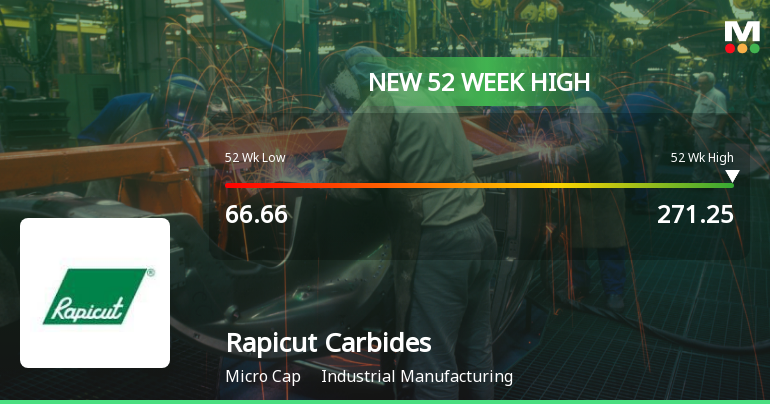
Broad-Based Technical Strength Lifts Rapicut Carbides Ltd to 52-Week High of Rs 271.25
Surging past its previous peaks, Rapicut Carbides Ltd touched a new 52-week high of Rs 271.25 on 14 Jul 2026, marking a remarkable rally of over 207% from its low of Rs 66.66 in the past year. This milestone comes amid a sustained four-day gain that has propelled the stock 14.11% higher, underscoring robust price momentum and a strong technical backdrop.
Read full news article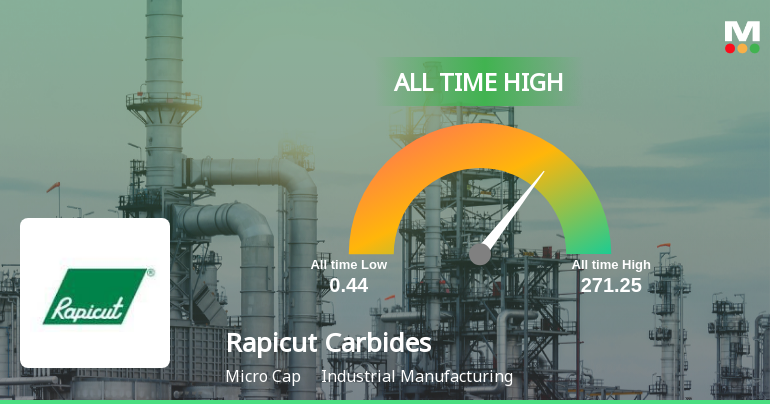
Rapicut Carbides Ltd Hits All-Time High of Rs 271.25 as Momentum Builds Across Timeframes
Extending its winning streak to four consecutive sessions, Rapicut Carbides Ltd surged to a fresh all-time high of Rs 271.25 on 14 Jul 2026, outperforming its sector and the broader market by a wide margin.
Read full news article
Rapicut Carbides Ltd is Rated Hold by MarketsMOJO
Rapicut Carbides Ltd is rated 'Hold' by MarketsMOJO, with this rating last updated on 16 June 2026. However, the analysis and financial metrics presented here reflect the stock's current position as of 09 July 2026, providing investors with the most recent insights into the company’s performance and outlook.
Read full news article Announcements
Compliances-Certificate under Reg. 74 (5) of SEBI (DP) Regulations 2018
13-Jul-2026 | Source : BSECompliance Certificate under Regulation 74(5) of SEBI DP Regulations 2018 for the quarter ended 30th June 2026.
Closure of Trading Window
29-Jun-2026 | Source : BSEClosure of Trading Window with effect from 1st July 2026 till 48 hours after the unaudited results for the quarter ended 30th June 2026 will be declared.
Board Meeting Outcome for Outcome Of Board Meeting Held On 30Th May 2026.
30-May-2026 | Source : BSEOutcome of Board Meeting held for considering Audited Financial Results for the quarter and year ended 31st March 2026.
Corporate Actions

No Upcoming Board Meetings

Rapicut Carbides Ltd has declared 15% dividend, ex-date: 19 Sep 19

No Splits history available

Rapicut Carbides Ltd has announced 3:2 bonus issue, ex-date: 20 Sep 13

No Rights history available
Quality key factors
Valuation key factors
Technicals key factors
 Technical Indicator Scale: Bearish, Mildly Bearish, Sideways, Mildly Bullish, Bullish Turned
 Shareholding Snapshot : Jun 2026
Shareholding Compare (%holding)
Non Institution
None
Held by 0 Schemes
Held by 0 FIIs
Abhishek Vipinchandra Gami (30.62%)
Mahendra Girdharilal Wadhwani (2.44%)
46.78%
Quarterly Results Snapshot (Standalone) - Mar'26 - QoQ

QoQ Growth in quarter ended Mar 2026 is 137.30% vs 31.35% in Dec 2025

QoQ Growth in quarter ended Mar 2026 is -58.60% vs 25.60% in Dec 2025
Half Yearly Results Snapshot (Standalone) - Sep'25
Growth in half year ended Sep 2025 is 32.06% vs -29.09% in Sep 2024
Growth in half year ended Sep 2025 is 84.76% vs -105.88% in Sep 2024
Nine Monthly Results Snapshot (Standalone) - Dec'25
YoY Growth in nine months ended Dec 2025 is 49.10% vs -27.13% in Dec 2024
YoY Growth in nine months ended Dec 2025 is 153.01% vs -5,220.00% in Dec 2024
Annual Results Snapshot (Standalone) - Mar'26
YoY Growth in year ended Mar 2026 is 129.29% vs -30.20% in Mar 2025
YoY Growth in year ended Mar 2026 is 188.41% vs -575.51% in Mar 2025
About Rapicut Carbides Ltd

Company Coordinates


