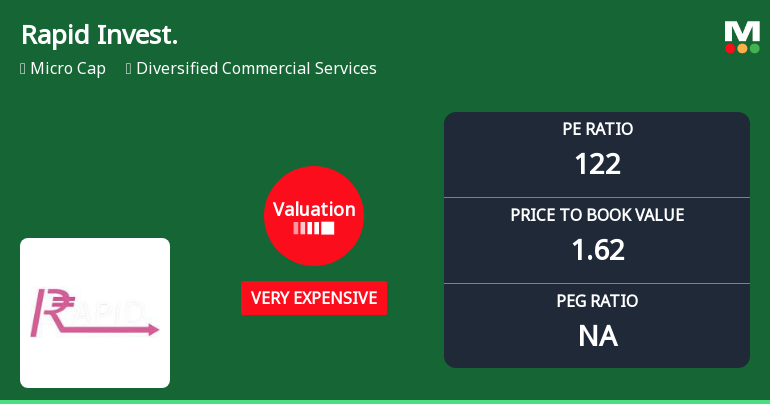
Rapid Invest.

  • Market Cap: Micro Cap
  • Industry: Diversified Commercial Services
  • ISIN: INE154M01012
  • NSEID:
  • BSEID: 501351
INR
75.00
0.00 (0.00%)
BSENSE

Jul 31, 03:30 PM

BSE+NSE Vol: 10

  • Price Points
  • Score
  • Mojo Parameters
  • Total Return
  • News and Corporate Actions
  • Key factors
  • Shareholding
  • Financials
  • CompanyCV
stock-summaryPrice Point
High/Low

1Day

52 Week

Valuation
Technical
Day's Volume

CASH

10 (400.00%) Volume

Shareholding (Jun 2026)

FII

0.00%

Held by 0 FIIs

DII

0.00%

Held by 0 DIIs

Promoter

70.55%

Why is Rapid Investments Ltd falling/rising?

01-Aug-2026

As of 31-Jul, the stock price of Rapid Investments Ltd is currently at 75.00, with no change from the previous trading session. The stock has declined 21.83% year-to-date and is trading below all key moving averages, indicating downward pressure and poor trading volume.

As of 31-Jul, the stock price of Rapid Investments Ltd is currently at 75.00, with no change from the previous trading session. The stock has shown a mixed performance over various periods, with a year-to-date decline of 21.83%, which is significantly worse than the Sensex's decline of 8.36%. Over the past month, the stock has decreased by 0.70%, while the Sensex has increased by 1.52%. <BR><BR>Today, the stock's performance is described as inline with the sector, but it has exhibited erratic trading, having not traded on 4 out of the last 20 days. Additionally, Rapid Investments Ltd is trading below its 5-day, 20-day, 50-day, 100-day, and 200-day moving averages, indicating a downward trend. Furthermore, there has been a notable decline in investor participation, with delivery volume on 21 July dropping by 82.43% compared to the 5-day average. <BR><BR>Overall, the combination of a significant year-to-date decline, poor trading volume, and trading below moving averages suggests that the stock is experiencing downward pressure, contributing to its current price stability at 75.00.

View full answer

What does Rapid Invest. do?

11-Jun-2026

Rapid Investments Ltd is a micro-cap Non-Banking Finance Company focused on providing mortgage loans to underserved semi-urban and rural markets in India. As of March 2026, it reported net sales of 1 Cr and a market cap of INR 17 Cr.

Overview:<BR>Rapid Investments Ltd is a leading player in the mortgage loans sector, primarily serving the unserved and unreached semi-urban and rural markets, and operates within the diversified commercial services industry as a micro-cap company.<BR><BR>History:<BR>Rapid Investments Ltd was incorporated on February 2, 1978, and was registered as a Non-Banking Finance Company under the Reserve Bank of India on May 25, 1998. The latest quarterly results reported net sales and net profit for the period ending March 2026.<BR><BR>Financial Snapshot:<BR>- Net Sales: 1 Cr (Quarterly Results - Mar 2026)<BR>- Net Profit: 0 Cr (Quarterly Results - Mar 2026)<BR>- Market Cap: INR 17 Cr (Micro Cap)<BR><BR>Key Metrics:<BR>- P/E: 107.00<BR>- Industry P/E: 20<BR>- Dividend Yield: 0.00%<BR>- Debt Equity: 0.00<BR>- Return on Equity: 1.42%<BR>- Price to Book: 1.52<BR><BR>Contact Details:<BR>Address: 107 Turf Estate Off E Moses Rd, Shakti Mill Lane Mahalaxmi Mumbai Maharashtra : 400011<BR>Tel: 91-22-24950532/28305988<BR>Email: rapidinvestor@gmail.com<BR>Website: http://www.rapidinvestments.co.in

View full answer

How big is Rapid Invest.?

11-Jun-2026

As of 10th June, Rapid Investments Ltd has a market capitalization of 17.00 Cr, with Net Sales of 2.06 Cr and a Net Profit of 0.16 Cr reported in the latest four quarters. Shareholder's Funds are 11.13 Cr and Total Assets are valued at 18.60 Cr as of March 2025.

As of 10th June, Rapid Investments Ltd has a market capitalization of 17.00 Cr, categorizing it as a Micro Cap company.<BR><BR>In the latest four quarters, Rapid Investments reported Net Sales of 2.06 Cr and a Net Profit of 0.16 Cr.<BR><BR>The latest annual period for the balance sheet is March 2025, with Shareholder's Funds amounting to 11.13 Cr and Total Assets valued at 18.60 Cr.

View full answer

Who are in the management team of Rapid Invest.?

11-Jun-2026

The management team of Rapid Invest includes Nina Ranka (Managing Director), Jitendra Nigam, Niraj Rathore, and Arun Jain (Independent Directors), Kanishk Ranka (Director), and Vijay Dalpatbhai Teraiyaan (Company Secretary).

The management team of Rapid Invest includes the following individuals:<BR><BR>1. **Nina Ranka** - Managing Director<BR>2. **Jitendra Nigam** - Independent Director<BR>3. **Niraj Rathore** - Independent Director<BR>4. **Arun Jain** - Independent Director<BR>5. **Kanishk Ranka** - Director<BR>6. **Vijay Dalpatbhai Teraiyaan** - Company Secretary<BR><BR>If you need more information about their roles or the company, feel free to ask!

View full answer

Who are the peers of the Rapid Invest.?

11-Jun-2026

Rapid Invest.'s peers include Shukra Bullions, Vrundavan Planta, Jayatma Enterp., Golech.Glob.Fin., Greencrest Finan, Disha Resources, S I Cap. & Fin., Samyak Internati, and Vishvprabha Ven. Notably, Jayatma Enterp. has the highest 1-year return at 376.29%, while Rapid Invest. has a return of -12.33%.

Peers: The peers of Rapid Invest. are Shukra Bullions, Vrundavan Planta, Jayatma Enterp., Golech.Glob.Fin., Greencrest Finan, Disha Resources, S I Cap. & Fin., Samyak Internati, and Vishvprabha Ven.<BR><BR>Quality Snapshot: Below Average management risk is observed at Shukra Bullions, Golech.Glob.Fin., Greencrest Finan, Disha Resources, S I Cap. & Fin., Samyak Internati, and Vishvprabha Ven., while Jayatma Enterp. does not qualify. Growth is rated as Excellent at Greencrest Finan, Good at Vrundavan Planta and S I Cap. & Fin., and Below Average at Shukra Bullions, Rapid Invest., Disha Resources, Samyak Internati, and Vishvprabha Ven., with Jayatma Enterp. not qualifying. Excellent capital structure is found at Golech.Glob.Fin., Greencrest Finan, Rapid Invest., Disha Resources, S I Cap. & Fin., and the rest have Below Average capital structure.<BR><BR>Return Snapshot: The peer with the highest 1-year return is Jayatma Enterp. at 376.29%, while the lowest is Vrundavan Planta at -38.25%. Rapid Invest.'s 1-year return is -12.33%, which is higher than Vrundavan Planta but lower than Jayatma Enterp. Additionally, the six-month return is negative for Vrundavan Planta, Greencrest Finan, S I Cap. & Fin., Samyak Internati, Vishvprabha Ven., and Shangar Decor.

View full answer

Should I buy, sell or hold Rapid Investments Ltd?

31-May-2026

When is the next results date for Rapid Investments Ltd?

27-May-2026

The next results date for Rapid Investments Ltd is 29 May 2026.

The next results date for Rapid Investments Ltd is scheduled for 29 May 2026.

View full answer

Are Rapid Investments Ltd latest results good or bad?

13-Feb-2026

Rapid Investments Ltd's latest Q3 FY26 results are concerning, showing a net profit decline of 84.62% and a negative operating margin of -28.57%. Overall, the financial performance indicates significant operational challenges and a downward trend in both revenue and profit.

Rapid Investments Ltd's latest results for Q3 FY26 indicate a troubling performance. The company reported a net profit of ₹0.02 crores, which reflects a significant decline of 84.62% compared to the previous quarter. Revenue also decreased by 12.50% quarter-on-quarter, totaling ₹0.35 crores. <BR><BR>Most concerning is the company's operating margin, which turned negative at -28.57%, a stark drop from a positive margin of 22.50% in Q2 FY26. This suggests that the core operations are currently unprofitable, marking a critical point for the company's financial health.<BR><BR>Additionally, the reliance on other income to maintain a positive net profit raises sustainability concerns. The overall financial performance shows a downward trend, with both revenue and profit metrics declining significantly. Given these factors, the latest results can be characterized as bad, highlighting serious operational challenges that need to be addressed for the company to regain stability and investor confidence.

View full answer

How has been the historical performance of Rapid Invest.?

15-Nov-2025

Rapid Invest's historical performance shows fluctuating net sales, peaking at 1.93 Cr in March 2024 before declining to 1.84 Cr in March 2025, while profitability improved with operating profit rising to 0.47 Cr and profit after tax reaching 0.36 Cr in March 2025. Total assets increased significantly to 18.60 Cr in March 2025, indicating overall growth despite recent sales decline.

Answer:<BR>The historical performance of Rapid Invest shows a fluctuating trend in net sales and profitability over the years. <BR><BR>Breakdown:<BR>Rapid Invest's net sales peaked at 1.93 Cr in March 2024 but declined to 1.84 Cr in March 2025, following a significant increase from 0.31 Cr in March 2023. The total operating income mirrored this trend, reaching 1.93 Cr in March 2024 and then falling to 1.84 Cr in March 2025. The company recorded an operating profit of 0.47 Cr in March 2025, a notable increase from 0.25 Cr in March 2024, and a significant rise from just 0.06 Cr in March 2023. Profit after tax also improved, reaching 0.36 Cr in March 2025 compared to 0.20 Cr in March 2024 and 0.03 Cr in March 2023. The company's total assets increased significantly to 18.60 Cr in March 2025 from 9.94 Cr in March 2024, while total liabilities also rose to 18.60 Cr in March 2025, reflecting a similar growth pattern. The cash flow from operating activities turned positive at 1.00 Cr in March 2025, contrasting with previous years where it was negative. Overall, Rapid Invest has shown improvement in profitability and asset growth, despite a recent decline in sales.

View full answer

Is Rapid Invest. overvalued or undervalued?

13-Oct-2025

As of October 10, 2025, Rapid Invest's valuation has shifted from attractive to fair, with a PE ratio of 20.22 indicating it may be undervalued compared to peers like Bajaj Finance (36.56) and Bajaj Finserv (33.63), despite a recent 22.53% stock decline, while still outperforming the Sensex over five years with a return of 188.50%.

As of 10 October 2025, the valuation grade for Rapid Invest has moved from attractive to fair, indicating a shift in its perceived value. The company is currently fairly valued based on its financial metrics. Key ratios include a PE ratio of 20.22, an EV to EBITDA of 20.20, and a PEG ratio of 0.31, which suggests that the stock may be undervalued relative to its growth potential.<BR><BR>In comparison to its peers, Rapid Invest's PE ratio is significantly lower than that of Bajaj Finance, which stands at 36.56, and higher than Life Insurance, which has a PE of 11.65. This positions Rapid Invest in a competitive light within its industry, particularly against peers like Bajaj Finserv, which is deemed expensive with a PE of 33.63. Despite recent stock performance showing a decline of 22.53% over the past week, Rapid Invest has outperformed the Sensex over a five-year period, with a return of 188.50% compared to the Sensex's 103.66%.

View full answer

Who are the top shareholders of the Rapid Invest.?

17-Jul-2025

The top shareholders of Rapid Invest are Reliable Holdings Private Limited with 42.13%, followed by Solution Commercials India Pvt Ltd at 9.03%, and individual investors holding 12.75%. There are no mutual funds or foreign institutional investors involved.

The top shareholders of Rapid Invest include Reliable Holdings Private Limited, which holds the largest stake at 42.13%. Following that, the highest public shareholder is Solution Commercials India Pvt Ltd, with a holding of 9.03%. Additionally, individual investors collectively hold 12.75% of the company's shares. There are no mutual funds or foreign institutional investors currently holding shares in the company.

View full answer

What is the technical trend for Rapid Invest.?

09-Jun-2025

As of June 3, 2025, Rapid Invest's technical trend has shifted to a moderately bearish stance, indicated by bearish MACD, Bollinger Bands, and moving averages across multiple timeframes.

As of 3 June 2025, the technical trend for Rapid Invest has changed from mildly bearish to bearish. The current stance is bearish with a moderate strength. Key indicators driving this include a bearish MACD on the weekly timeframe, bearish Bollinger Bands on both weekly and monthly timeframes, and a bearish moving average on the daily timeframe. The KST is mildly bearish on the weekly, while Dow Theory also indicates a mildly bearish trend on both weekly and monthly timeframes. Overall, the technical indicators suggest a negative outlook for the stock.

View full answer

Has Rapid Invest. declared dividend?

06-Jun-2025

Rapid Investments Ltd has declared a 5% dividend, but the dividend yield is currently 0%. Total returns have varied significantly, with a notable increase over longer periods despite recent declines.

Rapid Investments Ltd has declared a 5% dividend.<BR><BR>Dividend Details:<BR>- Percentage announced: 5%<BR>- Ex-date: 31 Aug 17<BR><BR>Dividend Yield: 0%<BR><BR>Total Returns by Period:<BR>In the last 6 months, the price return was -42.15%, the dividend return was 0%, resulting in a total return of -42.15%.<BR><BR>Over the past year, the price return was -25.71%, the dividend return was 0%, leading to a total return of -25.71%.<BR><BR>For the 2-year period, the price return was -9.23%, the dividend return was 0%, which resulted in a total return of -9.23%.<BR><BR>In the 3-year period, the price return was 0%, the dividend return was 0%, yielding a total return of 0.0%.<BR><BR>Over the last 4 years, the price return was 145.68%, the dividend return was 0%, culminating in a total return of 145.68%.<BR><BR>In the 5-year period, the price return was 150.58%, the dividend return was 0%, resulting in a total return of 150.58%.<BR><BR>Overall, Rapid Investments Ltd has declared a dividend, but the dividend yield remains at 0% in recent years, indicating that while there was a past dividend declaration, it has not been consistently paid out in subsequent periods. The total returns show significant fluctuations, with a notable increase over longer periods despite recent declines.

View full answer
iScoreScore
Click here to find our call on this stock
Strong Sell
Sell
Hold
Buy
Strong Buy

Dashboard

1

With a Operating Losses, the company has a Weak Long Term Fundamental Strength

  • Poor long term growth as Operating profit has grown by an annual rate of 3.71%
2

Negative results in Mar 26

3

With ROE of 1.4, it has a Expensive valuation with a 1.4 Price to Book Value

stock-summaryMojo Parameters

Mojo Parameters

Loading Valuation Snapshot...

Stock DNA

stock-summary
Industry

Diversified Commercial Services

stock-summary
Market cap

INR 16 Cr (Micro Cap)

stock-summary
P/E

101.00

stock-summary
Industry P/E

24

stock-summary
Dividend Yield

0.00%

stock-summary
Debt Equity

0.00

stock-summary
Return on Equity

1.42%

stock-summary
Price to Book

1.43

Revenue and Profits:
Net Sales:
1 Cr
(Quarterly Results - Mar 2026)
Net Profit:
0 Cr
stock-summaryTotal Returns
Total Returns (Price + Dividend) stock-summary
Dividend Yield (0%)
TimePeriod
Price Return
Dividend Return
Total Return
3 Months
-22.36%
0%
-22.36%
6 Months
-14.77%
0%
-14.77%
1 Year
9.57%
0%
9.57%
2 Years
-31.79%
0%
-31.79%
3 Years
0%
0%
0.0%
4 Years
-4.4%
0%
-4.4%
5 Years
125.56%
0%
125.56%

Rapid Invest. for the last several years.

Risk Adjusted Returns v/s stock-summary
Returns Beta
Icon
Beta has not been calculated since enough price history is not available
stock-summaryNews & Corporate Actions

Announcements stock-summary

Compliances-Certificate under Reg. 74 (5) of SEBI (DP) Regulations 2018

14-Jul-2026 | Source : BSE

Submission of Certificate under Regulation 74(5) of SEBI (Depositories & Participants) Regulations 2018 for the quarter ended 30.06.2026

Closure of Trading Window

27-Jun-2026 | Source : BSE

Pursuant to the provisions of SEBI (Prohibition of Insider Trading) Regulations 2015 as amended from time to time and Rapid Investment Limiteds Code of Conduct for Insiders the Trading Window for dealing in securities of the company shall remain closed for Designated Persons (as defined in the Code) including their immediate relatives with effect from 01st July 2026 till 48 hours after the announcement of the Un-Audited Financial Results of the Company for the quarter ended on 30th June 2026.

Board Meeting Outcome for Outcome Of The Board Meeting Held On 29/05/2026

29-May-2026 | Source : BSE

In terms of Regulation 30 & 33(3) of SEBI (Listing Obligations and Disclosure Requirement) Regulations 2015 this is to inform that the Meeting of the Board of Directors of the Company was held today on 29th May 2026 Friday at the corporate office 309 Pioneer Industrial Estate Subhash Road Jogeshwari (e) Mumbai 400060 at 03:00 p.m. and concluded around 07.05 p.m. The Board interalia considered approved and taken on record as follows. 1. The Audited Standalone Financial Results for the quarter and year ended 31st March 2026 along with the Audit Report thereon pursuant to Regulation 33 of SEBI (LODR) Regulations 2015. 2. Took note on Compliances made under SEBI (LODR) Regulation 2015 for the quarter and year ended 31st March 2026.

Corporate Actions stock-summary

stock-summary
BOARD MEETING

No Upcoming Board Meetings

stock-summary
DIVIDEND

Rapid Investments Ltd has declared 5% dividend, ex-date: 31 Aug 17

stock-summary
SPLITS

No Splits history available

stock-summary
BONUS

No Bonus history available

stock-summary
RIGHTS

Rapid Investments Ltd has announced 25:39 rights issue, ex-date: 17 Sep 24

stock-summaryKey Factors

Quality key factors stock-summary

Factor
Value
Sales Growth (5y)
19.43%
EBIT Growth (5y)
3.71%
Net Debt to Equity (avg)
0
Institutional Holding
0
ROE (avg)
2.89%

Valuation key factors

Factor
Value
P/E Ratio
101
Industry P/E
24
Price to Book Value
1.43
EV to EBIT
-8.42
EV to EBITDA
-8.42
EV to Capital Employed
2.35
EV to Sales
4.09
PEG Ratio
NA
Dividend Yield
NA
ROCE (Latest)
-2.79%
ROE (Latest)
1.42%

Technicals key factors

Indicator
Weekly
Monthly
MACD
Bearish
Mildly Bearish
RSI
No Signal
No Signal
Bollinger Bands
Mildly Bearish
Bearish
Moving Averages
Bearish (Daily)
KST
Mildly Bearish
Bearish
Dow Theory
No Trend
Mildly Bearish
stock-summary Technical Indicator Scale: Bearish, Mildly Bearish, Sideways, Mildly Bullish, Bullish  Turned 
stock-summaryShareholding
Shareholding Snapshot : Jun 2026stock-summary
Shareholding Compare (%holding) stock-summary
Majority shareholders

Promoters

Pledged Promoter Holdings

None

Mutual Funds

Held by 0 Schemes

FIIs

Held by 0 FIIs

Promoter with highest holding

Reliable Holdings Private Limited (42.13%)

Highest Public shareholder

Solution Commercials India Pvt Ltd (9.03%)

Individual Investors Holdings

12.73%

stock-summaryFinancial
[
  {
    "link": "quarterly",
    "btn_text": "All Quarterly Results",
    "header": "Quarterly Results Snapshot (Standalone) - Mar'26 - QoQ",
    "rhs": [
      {
        "prefix": "Net Sales ",
        "suffix": "QoQ Growth in quarter ended Mar 2026 is 117.14% vs -12.50% in Dec 2025",
        "dir": 1
      },
      {
        "prefix": "Standalone Net Profit ",
        "suffix": "QoQ Growth in quarter ended Mar 2026 is -850.00% vs -84.62% in Dec 2025",
        "dir": -1
      }
    ],
    "table": {
      "header": [
        "Mar'26",
        "Dec'25",
        "Change(%)"
      ],
      "body": [
        {
          "field": "Net Sales",
          "val1": "0.76",
          "val2": "0.35",
          "chgp": "117.14%",
          "chgp_class": "positive"
        },
        {
          "field": "Operating Profit (PBDIT) excl Other Income",
          "val1": "-0.22",
          "val2": "-0.10",
          "chgp": "-120.00%",
          "chgp_class": "negative"
        },
        {
          "field": "Interest",
          "val1": "0.00",
          "val2": "0.00",
          "chgp": "",
          "chgp_class": "neutral"
        },
        {
          "field": "Exceptional Items",
          "val1": "0.00",
          "val2": "0.00",
          "chgp": "",
          "chgp_class": "neutral"
        },
        {
          "field": "Standalone Net Profit",
          "val1": "-0.15",
          "val2": "0.02",
          "chgp": "-850.00%",
          "chgp_class": "negative"
        },
        {
          "field": "Operating Profit Margin (Excl OI)",
          "val1": "-28.95%",
          "val2": "-28.57%",
          "chgp": "-0.38%",
          "chgp_class": "negative"
        }
      ]
    }
  },
  {
    "link": "half-yearly",
    "btn_text": "All Half Yearly Results",
    "header": "Half Yearly Results Snapshot (Standalone) - Sep'25",
    "rhs": [
      {
        "prefix": "Net Sales ",
        "suffix": " Growth in half year ended Sep 2025 is 31.51% vs -19.78% in Sep 2024",
        "dir": 1
      },
      {
        "prefix": "Standalone Net Profit ",
        "suffix": " Growth in half year ended Sep 2025 is 314.29% vs -22.22% in Sep 2024",
        "dir": 1
      }
    ],
    "table": {
      "header": [
        "Sep'25",
        "Sep'24",
        "Change(%)"
      ],
      "body": [
        {
          "field": "Net Sales",
          "val1": "0.96",
          "val2": "0.73",
          "chgp": "31.51%",
          "chgp_class": "positive"
        },
        {
          "field": "Operating Profit (PBDIT) excl Other Income",
          "val1": "0.24",
          "val2": "0.09",
          "chgp": "166.67%",
          "chgp_class": "positive"
        },
        {
          "field": "Interest",
          "val1": "0.00",
          "val2": "0.00",
          "chgp": "",
          "chgp_class": "neutral"
        },
        {
          "field": "Exceptional Items",
          "val1": "0.00",
          "val2": "0.00",
          "chgp": "",
          "chgp_class": "neutral"
        },
        {
          "field": "Standalone Net Profit",
          "val1": "0.29",
          "val2": "0.07",
          "chgp": "314.29%",
          "chgp_class": "positive"
        },
        {
          "field": "Operating Profit Margin (Excl OI)",
          "val1": "25.00%",
          "val2": "12.33%",
          "chgp": "12.67%",
          "chgp_class": "positive"
        }
      ]
    }
  },
  {
    "link": "nine-monthly",
    "btn_text": "All Nine Monthly Results",
    "header": "Nine Monthly Results Snapshot (Standalone) - Dec'25",
    "rhs": [
      {
        "prefix": "Net Sales ",
        "suffix": "YoY Growth in nine months ended Dec 2025 is 3.97% vs -8.03% in Dec 2024",
        "dir": 1
      },
      {
        "prefix": "Standalone Net Profit ",
        "suffix": "YoY Growth in nine months ended Dec 2025 is 138.46% vs 8.33% in Dec 2024",
        "dir": 1
      }
    ],
    "table": {
      "header": [
        "Dec'25",
        "Dec'24",
        "Change(%)"
      ],
      "body": [
        {
          "field": "Net Sales",
          "val1": "1.31",
          "val2": "1.26",
          "chgp": "3.97%",
          "chgp_class": "positive"
        },
        {
          "field": "Operating Profit (PBDIT) excl Other Income",
          "val1": "0.14",
          "val2": "0.16",
          "chgp": "-12.50%",
          "chgp_class": "negative"
        },
        {
          "field": "Interest",
          "val1": "0.00",
          "val2": "0.00",
          "chgp": "",
          "chgp_class": "neutral"
        },
        {
          "field": "Exceptional Items",
          "val1": "0.00",
          "val2": "0.00",
          "chgp": "",
          "chgp_class": "neutral"
        },
        {
          "field": "Standalone Net Profit",
          "val1": "0.31",
          "val2": "0.13",
          "chgp": "138.46%",
          "chgp_class": "positive"
        },
        {
          "field": "Operating Profit Margin (Excl OI)",
          "val1": "10.69%",
          "val2": "12.70%",
          "chgp": "-2.01%",
          "chgp_class": "negative"
        }
      ]
    }
  },
  {
    "link": "annual",
    "btn_text": "All Annual Results",
    "header": "Annual Results Snapshot (Standalone) - Mar'26",
    "rhs": [
      {
        "prefix": "Net Sales ",
        "suffix": "YoY Growth in year ended Mar 2026 is 5.43% vs -4.66% in Mar 2025",
        "dir": 1
      },
      {
        "prefix": "Standalone Net Profit ",
        "suffix": "YoY Growth in year ended Mar 2026 is -55.56% vs 80.00% in Mar 2025",
        "dir": -1
      }
    ],
    "table": {
      "header": [
        "Mar'26",
        "Mar'25",
        "Change(%)"
      ],
      "body": [
        {
          "field": "Net Sales",
          "val1": "1.94",
          "val2": "1.84",
          "chgp": "5.43%",
          "chgp_class": "positive"
        },
        {
          "field": "Operating Profit (PBDIT) excl Other Income",
          "val1": "-0.22",
          "val2": "0.35",
          "chgp": "-162.86%",
          "chgp_class": "negative"
        },
        {
          "field": "Interest",
          "val1": "0.00",
          "val2": "0.00",
          "chgp": "",
          "chgp_class": "neutral"
        },
        {
          "field": "Exceptional Items",
          "val1": "0.00",
          "val2": "0.00",
          "chgp": "",
          "chgp_class": "neutral"
        },
        {
          "field": "Standalone Net Profit",
          "val1": "0.16",
          "val2": "0.36",
          "chgp": "-55.56%",
          "chgp_class": "negative"
        },
        {
          "field": "Operating Profit Margin (Excl OI)",
          "val1": "-11.34%",
          "val2": "19.02%",
          "chgp": "-30.36%",
          "chgp_class": "negative"
        }
      ]
    }
  }
]

Quarterly Results Snapshot (Standalone) - Mar'26 - QoQstock-summary

Mar'26
Dec'25
Change(%)
Net Sales
0.76
0.35
117.14%
Operating Profit (PBDIT) excl Other Income
-0.22
-0.10
-120.00%
Interest
0.00
0.00
Exceptional Items
0.00
0.00
Standalone Net Profit
-0.15
0.02
-850.00%
Operating Profit Margin (Excl OI)
-28.95%
-28.57%
-0.38%
Values in Rs Cr.
Direction Arrows
Net Sales

QoQ Growth in quarter ended Mar 2026 is 117.14% vs -12.50% in Dec 2025

Direction Arrows
Standalone Net Profit

QoQ Growth in quarter ended Mar 2026 is -850.00% vs -84.62% in Dec 2025

Half Yearly Results Snapshot (Standalone) - Sep'25stock-summary

Sep'25
Sep'24
Change(%)
Net Sales
0.96
0.73
31.51%
Operating Profit (PBDIT) excl Other Income
0.24
0.09
166.67%
Interest
0.00
0.00
Exceptional Items
0.00
0.00
Standalone Net Profit
0.29
0.07
314.29%
Operating Profit Margin (Excl OI)
25.00%
12.33%
12.67%
Values in Rs Cr.
Direction Arrows
Net Sales

Growth in half year ended Sep 2025 is 31.51% vs -19.78% in Sep 2024

Direction Arrows
Standalone Net Profit

Growth in half year ended Sep 2025 is 314.29% vs -22.22% in Sep 2024

Nine Monthly Results Snapshot (Standalone) - Dec'25stock-summary

Dec'25
Dec'24
Change(%)
Net Sales
1.31
1.26
3.97%
Operating Profit (PBDIT) excl Other Income
0.14
0.16
-12.50%
Interest
0.00
0.00
Exceptional Items
0.00
0.00
Standalone Net Profit
0.31
0.13
138.46%
Operating Profit Margin (Excl OI)
10.69%
12.70%
-2.01%
Values in Rs Cr.
Direction Arrows
Net Sales

YoY Growth in nine months ended Dec 2025 is 3.97% vs -8.03% in Dec 2024

Direction Arrows
Standalone Net Profit

YoY Growth in nine months ended Dec 2025 is 138.46% vs 8.33% in Dec 2024

Annual Results Snapshot (Standalone) - Mar'26stock-summary

Mar'26
Mar'25
Change(%)
Net Sales
1.94
1.84
5.43%
Operating Profit (PBDIT) excl Other Income
-0.22
0.35
-162.86%
Interest
0.00
0.00
Exceptional Items
0.00
0.00
Standalone Net Profit
0.16
0.36
-55.56%
Operating Profit Margin (Excl OI)
-11.34%
19.02%
-30.36%
Values in Rs Cr.
Direction Arrows
Net Sales

YoY Growth in year ended Mar 2026 is 5.43% vs -4.66% in Mar 2025

Direction Arrows
Standalone Net Profit

YoY Growth in year ended Mar 2026 is -55.56% vs 80.00% in Mar 2025

stock-summaryCompany CV
About Rapid Investments Ltd stock-summary
stock-summary
Rapid Investments Ltd
Micro Cap
Diversified Commercial Services
Rapid Investments Limited was incorporated on February 2, 1978 as a Limited Company. The Company also was registered as a Non-Banking Finance Company under Reserve Bank of India on 25 May, 1998. The Company is a leading player in Mortgage Loans since 2017-18 primarily in the unserved and unreached Semi urban & rural markets. Presently, it is operating in State of Rajasthan, having over 10 branches and has chalked out ambitious branch expansion and loan growth plans in the State.
Company Coordinates stock-summary
Company Details
107 Turf Estate Off E Moses Rd, Shakti Mill Lane Mahalaxmi Mumbai Maharashtra : 400011
stock-summary
Tel: 91-22-24950532/28305988
stock-summary
rapidinvestor@gmail.com
Registrar Details
Link Intime India Pvt Ltd, C-13 Pannalal Silk Compound, L B S Marg, Bhandup , Mumbai