
Compare Rapid Invest. with Similar Stocks
Dashboard
With a Operating Losses, the company has a Weak Long Term Fundamental Strength
- Poor long term growth as Operating profit has grown by an annual rate of 3.71%
Negative results in Mar 26
With ROE of 1.4, it has a Expensive valuation with a 1.5 Price to Book Value
Consistent Underperformance against the benchmark over the last 3 years
Stock DNA
Diversified Commercial Services
INR 17 Cr (Micro Cap)
107.00
21
0.00%
0.00
1.42%
1.51
Total Returns (Price + Dividend) 
Rapid Invest. for the last several years.
Risk Adjusted Returns v/s
Returns Beta

News
When is the next results date for Rapid Investments Ltd?
The next results date for Rapid Investments Ltd is scheduled for 29 May 2026....
Read full news article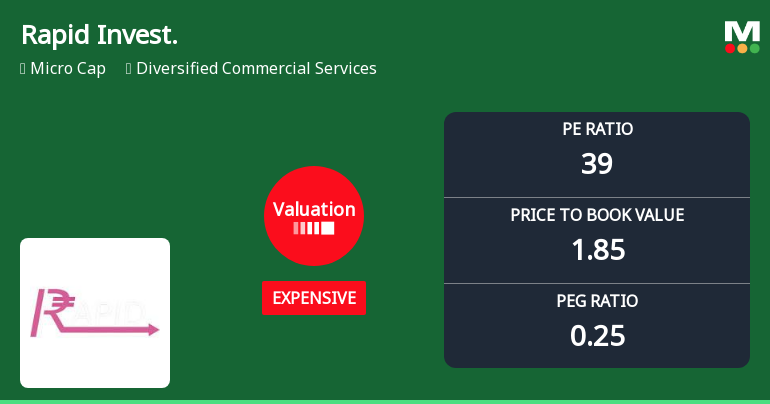
Rapid Investments Ltd Valuation Shifts Signal Elevated Price Risk Amid Mixed Returns
Rapid Investments Ltd, a micro-cap player in the Diversified Commercial Services sector, has seen its valuation parameters shift notably, raising questions about its price attractiveness amid a backdrop of mixed financial metrics and peer comparisons. The company’s price-to-earnings (P/E) ratio has surged to 39.21, marking a transition from fair to expensive territory, while other valuation multiples and returns metrics paint a complex picture for investors assessing its future prospects.
Read full news article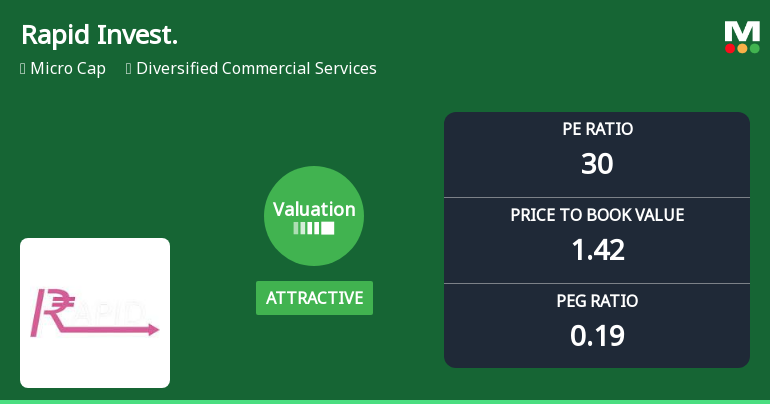
Rapid Investments Ltd Valuation Shifts Signal Changing Market Sentiment
Rapid Investments Ltd, a micro-cap player in the Diversified Commercial Services sector, has seen a notable shift in its valuation parameters, moving from a very attractive to an attractive rating. Despite a recent strong daily price gain of 5.00%, the company’s longer-term returns remain subdued compared to the broader market, prompting a detailed analysis of its price-to-earnings (P/E) and price-to-book value (P/BV) ratios in relation to historical and peer benchmarks.
Read full news article Announcements
Board Meeting Outcome for Outcome Of The Board Meeting Held On 29/05/2026
29-May-2026 | Source : BSEIn terms of Regulation 30 & 33(3) of SEBI (Listing Obligations and Disclosure Requirement) Regulations 2015 this is to inform that the Meeting of the Board of Directors of the Company was held today on 29th May 2026 Friday at the corporate office 309 Pioneer Industrial Estate Subhash Road Jogeshwari (e) Mumbai 400060 at 03:00 p.m. and concluded around 07.05 p.m. The Board interalia considered approved and taken on record as follows. 1. The Audited Standalone Financial Results for the quarter and year ended 31st March 2026 along with the Audit Report thereon pursuant to Regulation 33 of SEBI (LODR) Regulations 2015. 2. Took note on Compliances made under SEBI (LODR) Regulation 2015 for the quarter and year ended 31st March 2026.
Financial Results For The Quarter & Year Ending 31.03.2026
29-May-2026 | Source : BSEPursuant to Reg 33 of SEBI (LODR) Reg 2015 the board od Directors in their meeting held on 29.05.2026 have approved the Audited Financial Results alongwith the Balance sheet cash flow and Independent Audit Report for the year end 31.03.2026
Board Meeting Intimation for Intimation Of Board Meeting Under Regulation 29 Of The Securities And Exchange Board Of India (Listing Obligations .And Disclosure Requirements) Regulations 2015.
26-May-2026 | Source : BSERapid Investments Ltdhas informed BSE that the meeting of the Board of Directors of the Company is scheduled on 29/05/2026 inter alia to consider and approve In terms of Regulation 29 read with Regulation 30 and 33 of Securities & Exchange Board of India (Listing Obligations and Disclosures) Regulations 2015 this is to inform that the Meeting of the Board of Directors of M/s. Rapid Investments Limited will be held on 29th May 2026 Friday at the Corporate Office 309 Pioneer Industrial Estate Subhash Road Jogeshwari (e) Mumbai 400060 at 03.00 P.M. to consider and approve the followings: 1.To consider and approve Audited Standalone Financial Results for the Quarter and Year Ended 31st March 2026 along with Independent Audit Report thereon. 2. Any other items with the permission of Chairman. Further as informed vide our letter dated March 30 2026 the Trading Window for dealing in the securities of the Company was closed from April 01 2026 and shall remain closed till 48 hours after the announcement of financial results by the Board of Directors at its meeting scheduled to be held on May 29 2026. Kindly acknowledge the Receipt.
Corporate Actions

No Upcoming Board Meetings

Rapid Investments Ltd has declared 5% dividend, ex-date: 31 Aug 17

No Splits history available

No Bonus history available

Rapid Investments Ltd has announced 25:39 rights issue, ex-date: 17 Sep 24
Quality key factors
Valuation key factors
Technicals key factors
 Technical Indicator Scale: Bearish, Mildly Bearish, Sideways, Mildly Bullish, Bullish Turned
 Shareholding Snapshot : Mar 2026
Shareholding Compare (%holding)
Promoters
None
Held by 0 Schemes
Held by 0 FIIs
Reliable Holdings Private Limited (42.13%)
Solution Commercials India Pvt Ltd (9.03%)
12.73%
Quarterly Results Snapshot (Standalone) - Mar'26 - QoQ

QoQ Growth in quarter ended Mar 2026 is 117.14% vs -12.50% in Dec 2025

QoQ Growth in quarter ended Mar 2026 is -850.00% vs -84.62% in Dec 2025
Half Yearly Results Snapshot (Standalone) - Sep'25
Growth in half year ended Sep 2025 is 31.51% vs -19.78% in Sep 2024
Growth in half year ended Sep 2025 is 314.29% vs -22.22% in Sep 2024
Nine Monthly Results Snapshot (Standalone) - Dec'25
YoY Growth in nine months ended Dec 2025 is 3.97% vs -8.03% in Dec 2024
YoY Growth in nine months ended Dec 2025 is 138.46% vs 8.33% in Dec 2024
Annual Results Snapshot (Standalone) - Mar'26
YoY Growth in year ended Mar 2026 is 5.43% vs -4.66% in Mar 2025
YoY Growth in year ended Mar 2026 is -55.56% vs 80.00% in Mar 2025
About Rapid Investments Ltd

Company Coordinates


