Ras Resorts

  • Market Cap: Micro Cap
  • Industry: Hotels & Resorts
  • ISIN: INE651D01016
  • NSEID:
  • BSEID: 507966
INR
56.94
0.00 (0.00%)
BSENSE

Sep 01, 03:30 PM

BSE+NSE Vol: 165

  • Price Points
  • Score
  • Mojo Parameters
  • Total Return
  • News and Corporate Actions
  • Key factors
  • Shareholding
  • Financials
  • CompanyCV
stock-summaryPrice Point
High/Low

1Day

52 Week

Valuation
Technical
Day's Volume

CASH

165 (-45.26%) Volume

Shareholding (Jun 2026)

FII

0.00%

Held by 0 FIIs

DII

0.01%

Held by 0 DIIs

Promoter

74.34%

Why is Ras Resorts & Apart Hotels Ltd falling/rising?

02-Sep-2026

As of 01-Sep, Ras Resorts & Apart Hotels Ltd's stock price is stable at Rs 56.94, with a year-to-date increase of 39.01%. While recent gains reflect strong short-term market interest, concerns about the company's long-term fundamentals, including low ROCE and weak debt servicing ability, may warrant caution among investors.

As of 01-Sep, Ras Resorts & Apart Hotels Ltd's stock price is currently stable at Rs 56.94, showing no change from the previous trading session. However, the stock has demonstrated a positive performance over various periods, with a year-to-date increase of 39.01% and a one-year increase of 34.61%. This indicates a strong upward trend compared to the broader market, as the Sensex has declined by 9.71% year-to-date and 4.26% over the past year.<BR><BR>Today, the stock opened with a significant gain of 8.14%, reaching an intraday high of Rs 58.99, which reflects strong investor interest and positive market sentiment. Additionally, Ras Resorts has outperformed its sector by 2.03% today, suggesting that it is attracting attention despite some underlying weaknesses.<BR><BR>However, there are concerns regarding the company's long-term fundamentals. The average Return on Capital Employed (ROCE) is low at 3.86%, and the company's ability to service its debt is weak, indicated by a poor EBIT to Interest ratio of 0.89. Furthermore, the company's operating profit growth has been modest at an annual rate of 9.44% over the last five years. These factors could lead to caution among investors.<BR><BR>Despite these weaknesses, the stock's current performance and recent gains suggest that short-term market dynamics are favoring Ras Resorts, even as long-term fundamentals may raise concerns.

View full answer

Who are in the management team of Ras Resorts?

01-Sep-2026

The management team of Ras Resorts includes Pravin Vepari (Chairman), Vijay Ranjan, Ameet Hariani (Independent Directors), Nalini Shewakramani (Executive Director), Gautam Shewakramani, Rahul Shewakramani (Directors), Vishamber Shewakramani (Managing Director & CFO), and Binita Patel (Company Secretary & Compliance Officer).

The management team of Ras Resorts includes the following individuals:<BR><BR>1. Pravin Vepari - Chairman & Independent Director<BR>2. Vijay Ranjan - Independent Director<BR>3. Ameet Hariani - Independent Director<BR>4. Nalini Shewakramani - Executive Director<BR>5. Gautam Shewakramani - Director<BR>6. Vishamber Shewakramani - Managing Director & CFO<BR>7. Rahul Shewakramani - Director<BR>8. Binita Patel - Company Secretary & Compliance Officer<BR><BR>If you need more information about any specific member or their roles, feel free to ask!

View full answer

What does Ras Resorts do?

01-Sep-2026

Ras Resorts & Apart Hotels Ltd owns and operates hotels and resorts, classified as a Micro Cap company. As of June 2026, it reported net sales of 4 Cr and a market cap of INR 23 Cr.

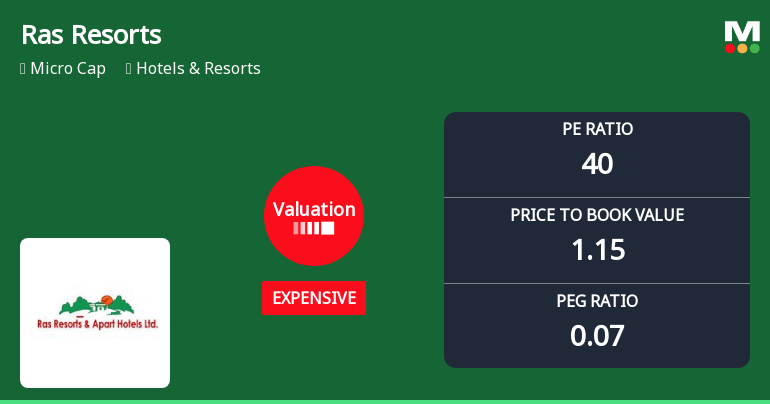
Overview:<BR>Ras Resorts & Apart Hotels Ltd is engaged in owning and operating hotels and resorts within the Hotels & Resorts industry, categorized as a Micro Cap company.<BR><BR>History:<BR>The company was incorporated in 1984 by a private Indian party. The latest quarterly results reported net sales and net profit for June 2026.<BR><BR>Financial Snapshot:<BR>- Net Sales: 4 Cr (Quarterly Results - Jun 2026)<BR>- Net Profit: 0 Cr (Quarterly Results - Jun 2026)<BR>- Market-cap: INR 23 Cr (Micro Cap)<BR><BR>Key Metrics:<BR>- P/E: 40.00<BR>- Industry P/E: 36<BR>- Dividend Yield: 0.00%<BR>- Debt Equity: 0.00<BR>- Return on Equity: 2.89%<BR>- Price to Book: 1.10<BR><BR>Contact Details:<BR>- Address: Rosewood Chambers, 99/C Tulsiwadi Tardeo Mumbai Maharashtra : 400034<BR>- Tel: 91-22-43216600<BR>- Email: mumbaioffice@rasresorts.com<BR>- Website: http://www.rrahl.com

View full answer

Who are the peers of the Ras Resorts?

01-Sep-2026

Peers of Ras Resorts include TGB Banquets, Reliable Ventur., Aruna Hotels, and others, with varying management and growth risks. Reliable Ventur. has the highest 1-year return at 6.89%, while Ras Resorts has a return of 37.04%.

Peers: The peers of Ras Resorts are TGB Banquets, Reliable Ventur., Aruna Hotels, Valencia India, Goel Food, Sri Havisha, Velan Hotels, Cindrella Hotels, H. S. India.<BR><BR>Quality Snapshot: Below Average management risk is observed at TGB Banquets, Reliable Ventur., Sri Havisha, H. S. India, and the rest. Average management risk is found at Aruna Hotels, Valencia India, Goel Food, Cindrella Hotels, while Velan Hotels does not qualify. Growth is rated as Good for Aruna Hotels, Goel Food, and H. S. India, while Below Average growth is noted for TGB Banquets, Reliable Ventur., Sri Havisha, Valencia India, and the rest. Capital Structure is rated as Good for Reliable Ventur., Average for TGB Banquets, Valencia India, Cindrella Hotels, and Below Average for Aruna Hotels, Goel Food, Ras Resorts, Sri Havisha, H. S. India.<BR><BR>Return Snapshot: The peer with the highest 1-year return is Reliable Ventur. at 6.89%, while the lowest is Valencia India at -36.40%. Ras Resorts has a 1-year return of 37.04%, which is significantly higher than Valencia India but lower than Reliable Ventur. Additionally, the peers with negative six-month returns include Aruna Hotels, Sri Havisha, and Cindrella Hotels.

View full answer

How big is Ras Resorts?

01-Sep-2026

As of 31st August, Ras Resorts & Apart Hotels Ltd has a market capitalization of 23.00 Cr, with recent net sales of 13.66 Cr and a net profit of 0.57 Cr. The company has shareholder's funds of 19.16 Cr and total assets of 29.94 Cr as of March 2025.

As of 31st August, Ras Resorts & Apart Hotels Ltd has a market capitalization of 23.00 Cr, categorizing it as a Micro Cap company.<BR><BR>In the latest 4 quarters, Ras Resorts reported Net Sales of 13.66 Cr and a Net Profit of 0.57 Cr.<BR><BR>For the latest annual period ending in March 2025, the company had Shareholder's Funds of 19.16 Cr and Total Assets amounting to 29.94 Cr.

View full answer

Should I buy, sell or hold Ras Resorts & Apart Hotels Ltd?

09-Aug-2026

Are Ras Resorts & Apart Hotels Ltd latest results good or bad?

08-Aug-2026

Ras Resorts & Apart Hotels Ltd's latest results are largely negative, with a significant 80% decline in net profit to ₹0.06 crores despite a slight revenue increase. The company faces operational challenges, as indicated by a sharp drop in margins, suggesting difficulties in converting revenue growth into profitability.

The latest results for Ras Resorts & Apart Hotels Ltd present a mixed picture, leaning more towards the negative side. In Q4 FY26, the company reported a net profit of just ₹0.06 crores, which is a significant decline of 80% compared to the previous quarter. This sharp drop in profitability occurred despite a slight revenue increase of 4% quarter-on-quarter, bringing total revenue to ₹3.90 crores.<BR><BR>The operational metrics also show concerning trends. The operating margin fell drastically to 8.46%, down from 15.47% in the prior quarter, indicating challenges in cost management and operational efficiency. Furthermore, the profit after tax (PAT) margin decreased to a mere 1.54%, down from 8.00% in Q3 FY26.<BR><BR>While the company has shown some revenue growth year-on-year, the substantial decline in net profit and the erosion of margins suggest that Ras Resorts is struggling to convert its top-line growth into bottom-line profitability. Additionally, the company's overall financial health is under scrutiny, with weak return ratios and a high tax burden further complicating its outlook.<BR><BR>In summary, while there was some revenue growth, the significant drop in net profit and margins indicates that the latest results are not favorable and highlight ongoing operational challenges for Ras Resorts.

View full answer

When is the next results date for Ras Resorts & Apart Hotels Ltd?

24-Jul-2026

The next results date for Ras Resorts & Apart Hotels Ltd is 08 August 2026.

The next results date for Ras Resorts & Apart Hotels Ltd is scheduled for 08 August 2026.

View full answer

Is Ras Resorts overvalued or undervalued?

11-Nov-2025

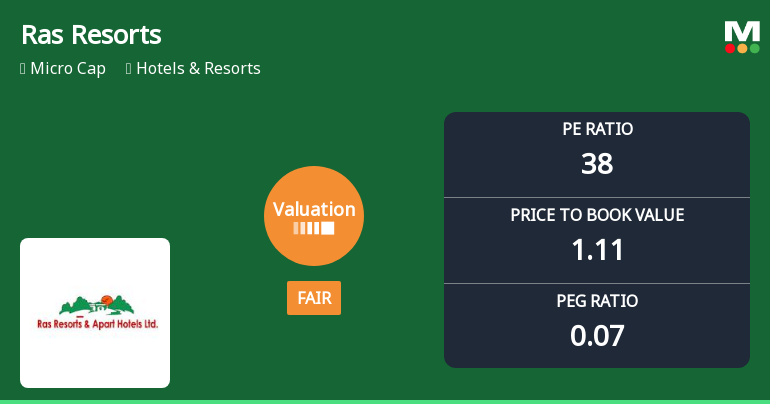
As of November 10, 2025, Ras Resorts is considered overvalued with a valuation grade of expensive, reflected by a PE ratio of 50.97 and a significant year-to-date drop of 16.74%, despite a recent stock return of 4.30% that outperformed the Sensex.

As of 10 November 2025, the valuation grade for Ras Resorts has moved from very expensive to expensive. The company is currently considered overvalued. Key ratios include a PE ratio of 50.97, an EV to EBITDA of 12.77, and a Price to Book Value of 0.82. Compared to peers, Indian Hotels Co has a PE ratio of 59.41 and EV to EBITDA of 33.82, while Chalet Hotels shows a PE of 34.21 and an EV to EBITDA of 23.35, indicating that Ras Resorts is trading at a premium relative to its industry.<BR><BR>Despite a recent stock return of 4.30% over the past week, which outperformed the Sensex's decline of 0.53%, the company's year-to-date performance shows a significant drop of 16.74%, contrasting with the Sensex's gain of 6.91%. This further emphasizes the overvaluation status of Ras Resorts in the current market context.

View full answer

How has been the historical performance of Ras Resorts?

09-Nov-2025

Ras Resorts has shown fluctuating financial performance, with net sales slightly decreasing to 12.97 Cr in Mar'25, while operating profit and profit after tax improved to 1.50 Cr and 0.33 Cr, respectively. Despite a decline in total assets and liabilities, the company demonstrated resilience with stable cash flow and increased earnings per share to 0.83.

Answer:<BR>The historical performance of Ras Resorts shows a fluctuating trend in key financial metrics over the years.<BR><BR>Breakdown:<BR>Ras Resorts has experienced variations in net sales, with figures of 12.97 Cr in Mar'25, slightly down from 13.12 Cr in Mar'24, and an increase from 12.87 Cr in Mar'23. The total operating income has remained relatively stable, reported at 13.22 Cr in Mar'25 compared to 13.30 Cr in Mar'24. The company's total expenditure, excluding depreciation, was 11.72 Cr in Mar'25, a decrease from 11.88 Cr in the previous year. Operating profit, excluding other income, has shown a positive trend, rising to 1.50 Cr in Mar'25 from 1.42 Cr in Mar'24. Profit before tax also improved to 0.46 Cr in Mar'25, up from 0.30 Cr in Mar'24, while profit after tax increased to 0.33 Cr from 0.18 Cr. The earnings per share (EPS) rose to 0.83 in Mar'25, compared to 0.46 in Mar'24. On the balance sheet, total assets decreased to 29.94 Cr in Mar'25 from 31.36 Cr in Mar'24, and total liabilities also declined to 29.94 Cr from 31.36 Cr. The cash flow from operating activities remained steady at 1.00 Cr in both Mar'25 and Mar'24, indicating consistent operational cash generation. Overall, Ras Resorts has shown resilience with improvements in profitability metrics despite fluctuations in sales and total assets.

View full answer

What is the technical trend for Ras Resorts?

09-Jun-2025

As of May 3, 2025, Ras Resorts exhibits a bearish technical trend, with bearish signals from the MACD, moving averages, and KST, despite mixed indications from the Dow Theory.

As of 3 May 2025, the technical trend for Ras Resorts has changed from mildly bearish to bearish. The weekly MACD is bearish, and the daily moving averages also indicate a bearish stance. The KST is bearish on a weekly basis, while the Bollinger Bands are mildly bearish on both weekly and monthly time frames. The Dow Theory shows a mildly bullish trend on the weekly but is bearish on the monthly, indicating mixed signals. Overall, the current technical stance is bearish, reflecting a weak market sentiment.

View full answer

Who are the top shareholders of the Ras Resorts?

06-Jun-2025

The top shareholder of Ras Resorts is Vishamber Shewakramani, holding 53.8% of the shares, with no pledged promoter holdings. The highest public shareholder is Vinodchandra Mansukhlal Parekh at 2.79%, while individual investors collectively own 19.89%.

The top shareholders of Ras Resorts are primarily the promoters, with Vishamber Shewakramani holding the largest stake at 53.8%. There are no pledged promoter holdings, and the company does not have any mutual fund or foreign institutional investor (FII) participation. The highest public shareholder is Vinodchandra Mansukhlal Parekh, who holds 2.79%. Additionally, individual investors collectively hold 19.89% of the shares.

View full answer

What is the bonus history of the Ras Resorts?

06-Jun-2025

Ras Resorts & Apart Hotels Ltd announced a 1:5 bonus issue on June 21, 2013, with a record date of June 25, 2013, meaning shareholders received one additional share for every five shares held.

Ras Resorts & Apart Hotels Ltd has a bonus history that includes a 1:5 bonus issue announced on June 21, 2013. The record date for this bonus was June 25, 2013. This means that for every five shares held, shareholders received one additional share as a bonus. If you have any more questions about the company or its financial activities, feel free to ask!

View full answer

Has Ras Resorts declared dividend?

06-Jun-2025

Yes, Ras Resorts & Apart Hotels Ltd has declared a 10% dividend, amounting to 1 per share, with an ex-date of March 22, 2016. However, the dividend yield is currently 0%, and total returns have varied significantly over different periods.

Ras Resorts & Apart Hotels Ltd has declared a 10% dividend.<BR><BR>Dividend Details:<BR>- Percentage announced: 10%<BR>- Amount per share: 1 per share<BR>- Ex-date: 22 Mar 16<BR><BR>Dividend Yield: 0%<BR><BR>Total Returns by Period:<BR>In the 6-month period, the price return was -12.13%, with a dividend return of 0%, resulting in a total return of -12.13%.<BR><BR>In the 1-year period, the price return was 43.77%, with a dividend return of 0%, resulting in a total return of 43.77%.<BR><BR>In the 2-year period, the price return was 32.84%, with a dividend return of 0%, resulting in a total return of 32.84%.<BR><BR>In the 3-year period, the price return was 83.27%, with a dividend return of 0%, resulting in a total return of 83.27%.<BR><BR>In the 4-year period, the price return was 47.94%, with a dividend return of 0%, resulting in a total return of 47.94%.<BR><BR>In the 5-year period, the price return was 9.51%, with a dividend return of 0%, resulting in a total return of 9.51%.<BR><BR>Overall, Ras Resorts has declared a dividend, but the dividend yield is currently 0%. The total returns over various periods show significant variability, with notable gains in the longer-term periods, particularly in the 1-year and 3-year spans.

View full answer
iScoreScore
Click here to find our call on this stock
Strong Sell
Sell
Hold
Buy
Strong Buy

Dashboard

1

Weak Long Term Fundamental Strength with an average Return on Capital Employed (ROCE) of 3.86%

  • Poor long term growth as Operating profit has grown by an annual rate 9.44% of over the last 5 years
  • Company's ability to service its debt is weak with a poor EBIT to Interest (avg) ratio of 0.89
2

Flat results in Jun 26

3

With ROE of 2.9, it has a Expensive valuation with a 1.1 Price to Book Value

stock-summaryMojo Parameters

Mojo Parameters

Loading Valuation Snapshot...

Stock DNA

stock-summary
Industry

Hotels & Resorts

stock-summary
Market cap

INR 23 Cr (Micro Cap)

stock-summary
P/E

40.00

stock-summary
Industry P/E

56

stock-summary
Dividend Yield

0.00%

stock-summary
Debt Equity

0.00

stock-summary
Return on Equity

2.89%

stock-summary
Price to Book

1.10

Revenue and Profits:
Net Sales:
4 Cr
(Quarterly Results - Jun 2026)
Net Profit:
0 Cr
stock-summaryTotal Returns
Total Returns (Price + Dividend) stock-summary
Dividend Yield (0%)
TimePeriod
Price Return
Dividend Return
Total Return
3 Months
9.44%
0%
9.44%
6 Months
34.17%
0%
34.17%
1 Year
34.61%
0%
34.61%
2 Years
23.46%
0%
23.46%
3 Years
29.09%
0%
29.09%
4 Years
55.15%
0%
55.15%
5 Years
113.66%
0%
113.66%

Latest dividend: 1 per share ex-dividend date: Mar-22-2016

Risk Adjusted Returns v/s stock-summary
Returns Beta
Icon
Beta has not been calculated since enough price history is not available
stock-summaryNews & Corporate Actions

News

Announcements stock-summary

Reg. 34 (1) Annual Report.

31-Aug-2026 | Source : BSE

Annual Report of Ras Resorts And Apart Hotels Limited for the financial year 2025-2026.

Pursuant To Regulation 36(1)(B) Of SEBI LODR Regulations 2015 The Company Has Sent Letter Providing Web Link Of Integrated Annual Report 2025-26.

31-Aug-2026 | Source : BSE

Pursuant to Regulation 36(1)(B) of SEBI LODR Regulations 2015 the company has sent letter providing web link of Integrated Annual Report 2025-26.

Announcement under Regulation 30 (LODR)-Newspaper Publication

29-Aug-2026 | Source : BSE

Notice to shareholders with respect to 42nd Annual General Meeting of Ras Resorts And Apart Hotels Limited

Corporate Actions stock-summary

stock-summary
BOARD MEETING

No Upcoming Board Meetings

stock-summary
DIVIDEND

Ras Resorts & Apart Hotels Ltd has declared 10% dividend, ex-date: 22 Mar 16

stock-summary
SPLITS

No Splits history available

stock-summary
BONUS

Ras Resorts & Apart Hotels Ltd has announced 1:5 bonus issue, ex-date: 21 Jun 13

stock-summary
RIGHTS

No Rights history available

stock-summaryKey Factors

Quality key factors stock-summary

Factor
Value
Sales Growth (5y)
20.96%
EBIT Growth (5y)
9.44%
EBIT to Interest (avg)
0.89
Debt to EBITDA (avg)
3.28
Net Debt to Equity (avg)
0
Sales to Capital Employed (avg)
0.48
Tax Ratio
28.57%
Dividend Payout Ratio
0
Pledged Shares
0
Institutional Holding
0.01%
ROCE (avg)
3.58%
ROE (avg)
1.26%

Valuation key factors

Factor
Value
P/E Ratio
40
Industry P/E
56
Price to Book Value
1.14
EV to EBIT
21.12
EV to EBITDA
14.21
EV to Capital Employed
1.14
EV to Sales
1.63
PEG Ratio
0.07
Dividend Yield
NA
ROCE (Latest)
5.27%
ROE (Latest)
2.89%

Technicals key factors

Indicator
Weekly
Monthly
MACD
Mildly Bearish
Bullish
RSI
No Signal
No Signal
Bollinger Bands
Bullish
Bullish
Moving Averages
Bullish (Daily)
KST
Mildly Bearish
Bullish
Dow Theory
No Trend
Mildly Bullish
stock-summary Technical Indicator Scale: Bearish, Mildly Bearish, Sideways, Mildly Bullish, Bullish  Turned 
stock-summaryShareholding
Shareholding Snapshot : Jun 2026stock-summary
Shareholding Compare (%holding) stock-summary
Majority shareholders

Promoters

Pledged Promoter Holdings

None

Mutual Funds

Held by 0 Schemes

FIIs

Held by 0 FIIs

Promoter with highest holding

Vishamber Shewakramani (53.8%)

Highest Public shareholder

Vinodchandra Mansukhlal Parekh (2.79%)

Individual Investors Holdings

20.5%

stock-summaryFinancial
[
  {
    "link": "quarterly",
    "btn_text": "All Quarterly Results",
    "header": "Quarterly Results Snapshot (Standalone) - Jun'26 - YoY",
    "rhs": [
      {
        "prefix": "Net Sales ",
        "suffix": "YoY Growth in quarter ended Jun 2026 is 23.02% vs -11.01% in Jun 2025",
        "dir": 1
      },
      {
        "prefix": "Standalone Net Profit ",
        "suffix": "YoY Growth in quarter ended Jun 2026 is 33.33% vs -66.67% in Jun 2025",
        "dir": 1
      }
    ],
    "table": {
      "header": [
        "Jun'26",
        "Jun'25",
        "Change(%)"
      ],
      "body": [
        {
          "field": "Net Sales",
          "val1": "3.58",
          "val2": "2.91",
          "chgp": "23.02%",
          "chgp_class": "positive"
        },
        {
          "field": "Operating Profit (PBDIT) excl Other Income",
          "val1": "0.44",
          "val2": "0.39",
          "chgp": "12.82%",
          "chgp_class": "positive"
        },
        {
          "field": "Interest",
          "val1": "0.06",
          "val2": "0.09",
          "chgp": "-33.33%",
          "chgp_class": "positive"
        },
        {
          "field": "Exceptional Items",
          "val1": "0.00",
          "val2": "0.00",
          "chgp": "",
          "chgp_class": "neutral"
        },
        {
          "field": "Standalone Net Profit",
          "val1": "0.16",
          "val2": "0.12",
          "chgp": "33.33%",
          "chgp_class": "positive"
        },
        {
          "field": "Operating Profit Margin (Excl OI)",
          "val1": "12.29%",
          "val2": "13.40%",
          "chgp": "-1.11%",
          "chgp_class": "negative"
        }
      ]
    }
  },
  {
    "link": "half-yearly",
    "btn_text": "All Half Yearly Results",
    "header": "Half Yearly Results Snapshot (Standalone) - Sep'25",
    "rhs": [
      {
        "prefix": "Net Sales ",
        "suffix": " Growth in half year ended Sep 2025 is -9.93% vs 0.00% in Sep 2024",
        "dir": -1
      },
      {
        "prefix": "Standalone Net Profit ",
        "suffix": " Growth in half year ended Sep 2025 is -10.53% vs 850.00% in Sep 2024",
        "dir": -1
      }
    ],
    "table": {
      "header": [
        "Sep'25",
        "Sep'24",
        "Change(%)"
      ],
      "body": [
        {
          "field": "Net Sales",
          "val1": "5.35",
          "val2": "5.94",
          "chgp": "-9.93%",
          "chgp_class": "negative"
        },
        {
          "field": "Operating Profit (PBDIT) excl Other Income",
          "val1": "0.64",
          "val2": "0.80",
          "chgp": "-20.00%",
          "chgp_class": "negative"
        },
        {
          "field": "Interest",
          "val1": "0.17",
          "val2": "0.27",
          "chgp": "-37.04%",
          "chgp_class": "positive"
        },
        {
          "field": "Exceptional Items",
          "val1": "0.00",
          "val2": "0.00",
          "chgp": "",
          "chgp_class": "neutral"
        },
        {
          "field": "Standalone Net Profit",
          "val1": "0.17",
          "val2": "0.19",
          "chgp": "-10.53%",
          "chgp_class": "negative"
        },
        {
          "field": "Operating Profit Margin (Excl OI)",
          "val1": "11.96%",
          "val2": "13.47%",
          "chgp": "-1.51%",
          "chgp_class": "negative"
        }
      ]
    }
  },
  {
    "link": "nine-monthly",
    "btn_text": "All Nine Monthly Results",
    "header": "Nine Monthly Results Snapshot (Standalone) - Dec'25",
    "rhs": [
      {
        "prefix": "Net Sales ",
        "suffix": "YoY Growth in nine months ended Dec 2025 is -5.41% vs 4.45% in Dec 2024",
        "dir": -1
      },
      {
        "prefix": "Standalone Net Profit ",
        "suffix": "YoY Growth in nine months ended Dec 2025 is 46.87% vs 200.00% in Dec 2024",
        "dir": -1
      }
    ],
    "table": {
      "header": [
        "Dec'25",
        "Dec'24",
        "Change(%)"
      ],
      "body": [
        {
          "field": "Net Sales",
          "val1": "9.10",
          "val2": "9.62",
          "chgp": "-5.41%",
          "chgp_class": "negative"
        },
        {
          "field": "Operating Profit (PBDIT) excl Other Income",
          "val1": "1.22",
          "val2": "1.23",
          "chgp": "-0.81%",
          "chgp_class": "negative"
        },
        {
          "field": "Interest",
          "val1": "0.24",
          "val2": "0.39",
          "chgp": "-38.46%",
          "chgp_class": "positive"
        },
        {
          "field": "Exceptional Items",
          "val1": "0.00",
          "val2": "0.00",
          "chgp": "",
          "chgp_class": "neutral"
        },
        {
          "field": "Standalone Net Profit",
          "val1": "0.47",
          "val2": "0.32",
          "chgp": "46.87%",
          "chgp_class": "positive"
        },
        {
          "field": "Operating Profit Margin (Excl OI)",
          "val1": "13.26%",
          "val2": "12.58%",
          "chgp": "0.68%",
          "chgp_class": "positive"
        }
      ]
    }
  },
  {
    "link": "annual",
    "btn_text": "All Annual Results",
    "header": "Annual Results Snapshot (Standalone) - Mar'26",
    "rhs": [
      {
        "prefix": "Net Sales ",
        "suffix": "YoY Growth in year ended Mar 2026 is 0.23% vs -1.14% in Mar 2025",
        "dir": 1
      },
      {
        "prefix": "Standalone Net Profit ",
        "suffix": "YoY Growth in year ended Mar 2026 is 57.58% vs 83.33% in Mar 2025",
        "dir": -1
      }
    ],
    "table": {
      "header": [
        "Mar'26",
        "Mar'25",
        "Change(%)"
      ],
      "body": [
        {
          "field": "Net Sales",
          "val1": "13.00",
          "val2": "12.97",
          "chgp": "0.23%",
          "chgp_class": "positive"
        },
        {
          "field": "Operating Profit (PBDIT) excl Other Income",
          "val1": "1.56",
          "val2": "1.50",
          "chgp": "4.00%",
          "chgp_class": "positive"
        },
        {
          "field": "Interest",
          "val1": "0.33",
          "val2": "0.50",
          "chgp": "-34.00%",
          "chgp_class": "positive"
        },
        {
          "field": "Exceptional Items",
          "val1": "0.00",
          "val2": "0.00",
          "chgp": "",
          "chgp_class": "neutral"
        },
        {
          "field": "Standalone Net Profit",
          "val1": "0.52",
          "val2": "0.33",
          "chgp": "57.58%",
          "chgp_class": "positive"
        },
        {
          "field": "Operating Profit Margin (Excl OI)",
          "val1": "12.00%",
          "val2": "11.57%",
          "chgp": "0.43%",
          "chgp_class": "positive"
        }
      ]
    }
  }
]

Quarterly Results Snapshot (Standalone) - Jun'26 - YoYstock-summary

Jun'26
Jun'25
Change(%)
Net Sales
3.58
2.91
23.02%
Operating Profit (PBDIT) excl Other Income
0.44
0.39
12.82%
Interest
0.06
0.09
-33.33%
Exceptional Items
0.00
0.00
Standalone Net Profit
0.16
0.12
33.33%
Operating Profit Margin (Excl OI)
12.29%
13.40%
-1.11%
Values in Rs Cr.
Direction Arrows
Net Sales

YoY Growth in quarter ended Jun 2026 is 23.02% vs -11.01% in Jun 2025

Direction Arrows
Standalone Net Profit

YoY Growth in quarter ended Jun 2026 is 33.33% vs -66.67% in Jun 2025

Half Yearly Results Snapshot (Standalone) - Sep'25stock-summary

Sep'25
Sep'24
Change(%)
Net Sales
5.35
5.94
-9.93%
Operating Profit (PBDIT) excl Other Income
0.64
0.80
-20.00%
Interest
0.17
0.27
-37.04%
Exceptional Items
0.00
0.00
Standalone Net Profit
0.17
0.19
-10.53%
Operating Profit Margin (Excl OI)
11.96%
13.47%
-1.51%
Values in Rs Cr.
Direction Arrows
Net Sales

Growth in half year ended Sep 2025 is -9.93% vs 0.00% in Sep 2024

Direction Arrows
Standalone Net Profit

Growth in half year ended Sep 2025 is -10.53% vs 850.00% in Sep 2024

Nine Monthly Results Snapshot (Standalone) - Dec'25stock-summary

Dec'25
Dec'24
Change(%)
Net Sales
9.10
9.62
-5.41%
Operating Profit (PBDIT) excl Other Income
1.22
1.23
-0.81%
Interest
0.24
0.39
-38.46%
Exceptional Items
0.00
0.00
Standalone Net Profit
0.47
0.32
46.87%
Operating Profit Margin (Excl OI)
13.26%
12.58%
0.68%
Values in Rs Cr.
Direction Arrows
Net Sales

YoY Growth in nine months ended Dec 2025 is -5.41% vs 4.45% in Dec 2024

Direction Arrows
Standalone Net Profit

YoY Growth in nine months ended Dec 2025 is 46.87% vs 200.00% in Dec 2024

Annual Results Snapshot (Standalone) - Mar'26stock-summary

Mar'26
Mar'25
Change(%)
Net Sales
13.00
12.97
0.23%
Operating Profit (PBDIT) excl Other Income
1.56
1.50
4.00%
Interest
0.33
0.50
-34.00%
Exceptional Items
0.00
0.00
Standalone Net Profit
0.52
0.33
57.58%
Operating Profit Margin (Excl OI)
12.00%
11.57%
0.43%
Values in Rs Cr.
Direction Arrows
Net Sales

YoY Growth in year ended Mar 2026 is 0.23% vs -1.14% in Mar 2025

Direction Arrows
Standalone Net Profit

YoY Growth in year ended Mar 2026 is 57.58% vs 83.33% in Mar 2025

stock-summaryCompany CV
About Ras Resorts & Apart Hotels Ltd stock-summary
stock-summary
Ras Resorts & Apart Hotels Ltd
Micro Cap
Hotels & Resorts
Ras Resorts & Apart Hotels Ltd. was incorporated in 1984, by a private Indian party. The Company is primarily engaged in the business of owning, operating hotel and resort. Ras Resorts, on the bank of river Daman ganga, with lush green lawns bordered with trees & fresh countryside air, is just two and a half hour drive away from Mumbai and two hour drive from Surat. The resort offers 100 rooms including Standard, Deluxe and Executive style rooms.
Company Coordinates stock-summary
Company Details
Rosewood Chambers, 99/C Tulsiwadi Tardeo Mumbai Maharashtra : 400034
stock-summary
Tel: 91-22-43216600
stock-summary
mumbaioffice@rasresorts.com
Registrar Details