
Compare Rasandik Engg. with Similar Stocks
Dashboard
With a Operating Losses, the company has a Weak Long Term Fundamental Strength
- Low ability to service debt as the company has a high Debt to EBITDA ratio of 19.26 times
- The company has been able to generate a Return on Equity (avg) of 2.06% signifying low profitability per unit of shareholders funds
Flat results in Mar 26
Risky - Negative Operating Profits
Consistent Underperformance against the benchmark over the last 3 years
Stock DNA
Auto Components & Equipments
INR 39 Cr (Micro Cap)
NA (Loss Making)
35
0.00%
0.25
-7.47%
0.44
Total Returns (Price + Dividend) 
Latest dividend: 1.5000 per share ex-dividend date: Sep-04-2008
Risk Adjusted Returns v/s
Returns Beta

News
Are Rasandik Engineering Industries India Ltd latest results good or bad?
Rasandik Engineering Industries India Ltd's latest financial results for Q4 FY26 reflect significant operational challenges despite a notable increase in revenue. The company reported net sales of ₹19.02 crores, marking a year-on-year growth of 39.34%. However, this revenue growth did not translate into profitability, as the company faced a net loss of ₹2.60 crores, which represents a substantial decline compared to the previous year. The operating margin fell to negative 1.58%, the lowest in seven quarters, indicating severe cost pressures that overwhelmed the revenue gains. This is a stark contrast to the positive operating margin of 4.62% reported in Q4 FY25. Additionally, the profit after tax (PAT) margin worsened to negative 13.67%, highlighting ongoing profitability issues. The financial data reveals that Rasandik Engineering has struggled with operational efficiency, as evidenced by the negative op...
Read full news article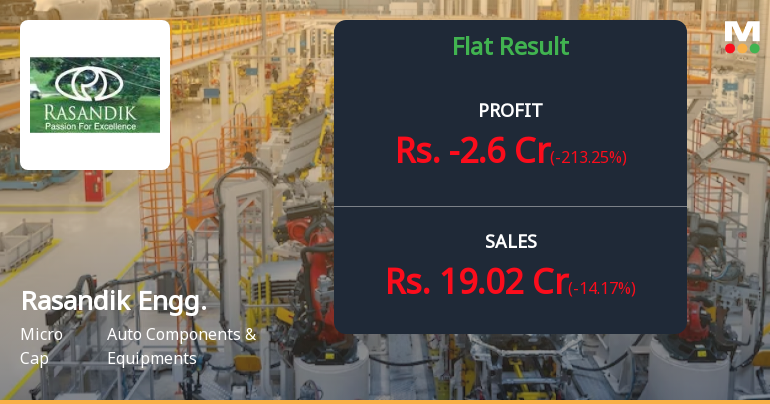
Rasandik Engineering Industries India Ltd Q4 FY26: Mounting Losses Deepen Crisis for Auto Component Maker
Rasandik Engineering Industries India Ltd., a micro-cap auto component manufacturer specialising in sheet metal components and muffler assemblies, reported a widening net loss of ₹2.60 crores for Q4 FY26, marking a dramatic deterioration from the ₹1.11 crores loss posted in Q4 FY25. The results underscore deepening operational challenges at the Gurugram-based company, which has struggled with persistent losses across recent quarters despite revenue growth. The stock plunged 4.20% to ₹66.08 on May 20, 2026, extending its dismal one-year decline of 33.16% and trading nearly 40% below its 52-week high of ₹109.40.
Read full news article
Rasandik Engineering Industries India Ltd is Rated Strong Sell
Rasandik Engineering Industries India Ltd is rated Strong Sell by MarketsMOJO. This rating was last updated on 27 Jan 2025. However, the analysis and financial metrics discussed here reflect the company’s current position as of 20 May 2026, providing investors with an up-to-date perspective on the stock’s fundamentals, valuation, financial trend, and technical outlook.
Read full news article Announcements
Intimation Regarding Appointment Of Internal Auditor
23-May-2026 | Source : BSEAppointment of Internal Auditor
Announcement under Regulation 30 (LODR)-Newspaper Publication
21-May-2026 | Source : BSENewspaper Publication
Submission Of Audited Financial Results For The Quarter And Year Ended March 31 2026 Under Regulation 33 Of SEBI (LODR) Regulations 2015
20-May-2026 | Source : BSESubmission of Audited Financial Result for the Quarter and Year ended March 31 2026
Corporate Actions

No Upcoming Board Meetings

Rasandik Engineering Industries India Ltd has declared 15% dividend, ex-date: 04 Sep 08

No Splits history available

No Bonus history available

No Rights history available
Quality key factors
Valuation key factors
Technicals key factors
 Technical Indicator Scale: Bearish, Mildly Bearish, Sideways, Mildly Bullish, Bullish Turned
 Shareholding Snapshot : Mar 2026
Shareholding Compare (%holding)
Promoters
0.2551
Held by 3 Schemes (0.05%)
Held by 1 FIIs (1.1%)
Radhika Securities Pvt. Ltd. (24.52%)
Hitesh Ramji Javeri (2.18%)
37.55%
Quarterly Results Snapshot (Standalone) - Mar'26 - QoQ

QoQ Growth in quarter ended Mar 2026 is -14.17% vs 75.46% in Dec 2025
QoQ Growth in quarter ended Mar 2026 is -213.25% vs 61.03% in Dec 2025
Half Yearly Results Snapshot (Standalone) - Sep'25

Growth in half year ended Sep 2025 is -22.45% vs -30.84% in Sep 2024
Growth in half year ended Sep 2025 is -139.71% vs -281.33% in Sep 2024
Nine Monthly Results Snapshot (Standalone) - Dec'25
YoY Growth in nine months ended Dec 2025 is 0.27% vs -27.88% in Dec 2024
YoY Growth in nine months ended Dec 2025 is 8.71% vs 20.00% in Dec 2024
Annual Results Snapshot (Standalone) - Mar'26
YoY Growth in year ended Mar 2026 is 8.85% vs -27.91% in Mar 2025
YoY Growth in year ended Mar 2026 is -19.89% vs -178.26% in Mar 2025
About Rasandik Engineering Industries India Ltd

Company Coordinates


