
Dashboard
Low ability to service debt as the company has a high Debt to EBITDA ratio of 4.39 times
- Low ability to service debt as the company has a high Debt to EBITDA ratio of 4.39 times
Poor long term growth as Operating profit has grown by an annual rate 2.41% of over the last 5 years
With ROCE of 7.1, it has a Attractive valuation with a 1.3 Enterprise value to Capital Employed
Despite the size of the company, domestic mutual funds hold only 0.58% of the company
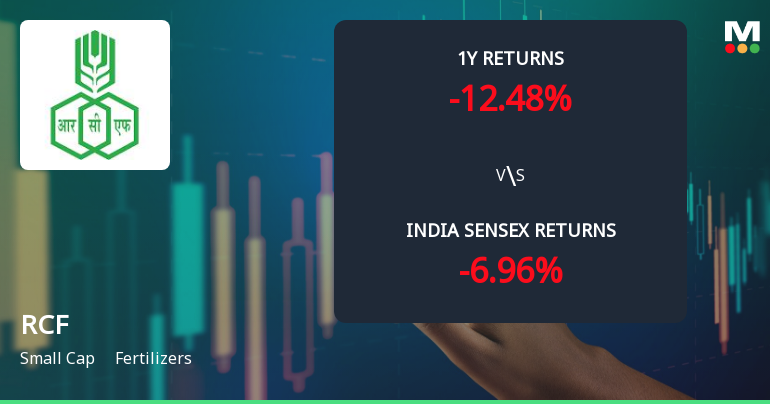
Underperformed the market in the last 1 year
Stock DNA
Fertilizers
INR 7,354 Cr (Small Cap)
19.00
24
1.71%
0.78
7.75%
1.45
Total Returns (Price + Dividend) 
Latest dividend: 1.001156069364162 per share ex-dividend date: Feb-20-2026
Risk Adjusted Returns v/s
Returns Beta

News
Rashtriya Chemicals & Fertilizers Ltd. Technical Momentum Shifts to Sideways Amid Mixed Indicators
Rashtriya Chemicals & Fertilizers Ltd. (RCF) has experienced a notable shift in its technical momentum, moving from a mildly bearish stance to a sideways trend. Despite a modest decline of 1.72% in the latest session, the stock’s technical indicators present a complex picture, with weekly signals showing mild bullishness contrasting with monthly bearish undertones. This nuanced technical landscape warrants a detailed analysis for investors seeking clarity on RCF’s near-term prospects within the fertilizers sector.
Read full news article
Rashtriya Chemicals & Fertilizers Ltd. Technical Momentum Shifts Amid Mixed Indicator Signals
Rashtriya Chemicals & Fertilizers Ltd. (RCF) has experienced a subtle shift in its technical momentum, moving from a sideways trend to a mildly bearish stance. Despite a modest day change of -0.04%, the stock’s technical indicators present a complex picture, with weekly and monthly signals diverging across key metrics such as MACD, RSI, Bollinger Bands, and moving averages. This nuanced technical landscape warrants a detailed analysis for investors seeking clarity on RCF’s near-term prospects.
Read full news article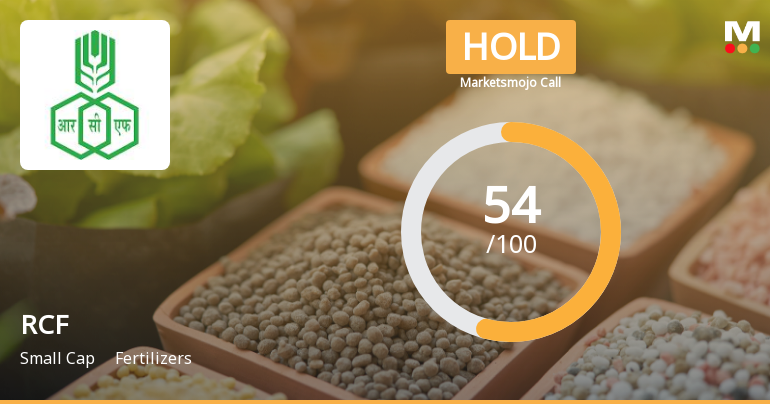
Rashtriya Chemicals & Fertilizers Ltd. Upgraded to Hold on Technical Improvements and Financial Gains
Rashtriya Chemicals & Fertilizers Ltd. (RCF) has seen its investment rating upgraded from Sell to Hold, reflecting a nuanced improvement across technical indicators, valuation metrics, financial trends, and overall quality. This reassessment comes amid a backdrop of mixed market performance and evolving company fundamentals, signalling cautious optimism among investors and analysts alike.
Read full news article Announcements
Compliances-Reg.24(A)-Annual Secretarial Compliance
30-May-2026 | Source : BSEAttached
Intimation Under Regulation 30 Of SEBI (Listing Obligations And Disclosure Requirements) Regulations 2015 - (SEBI LODR)
28-May-2026 | Source : BSEIntimation enclosed herewith
Announcement under Regulation 30 (LODR)-Newspaper Publication
22-May-2026 | Source : BSEIntimation enclosed herewith
Corporate Actions

No Upcoming Board Meetings

Rashtriya Chemicals & Fertilizers Ltd. has declared 10% dividend, ex-date: 20 Feb 26

No Splits history available

No Bonus history available

No Rights history available
Quality key factors
Valuation key factors
Technicals key factors
 Technical Indicator Scale: Bearish, Mildly Bearish, Sideways, Mildly Bullish, Bullish Turned
 Shareholding Snapshot : Mar 2026
Shareholding Compare (%holding)
Promoters
None
Held by 11 Schemes (0.14%)
Held by 92 FIIs (2.6%)
President Of India (75.0%)
None
19.43%
Quarterly Results Snapshot (Consolidated) - Mar'26 - YoY

YoY Growth in quarter ended Mar 2026 is 49.63% vs -3.87% in Mar 2025
YoY Growth in quarter ended Mar 2026 is 157.69% vs -23.92% in Mar 2025
Half Yearly Results Snapshot (Consolidated) - Sep'25

Growth in half year ended Sep 2025 is -0.26% vs 5.95% in Sep 2024
Growth in half year ended Sep 2025 is 78.01% vs -24.46% in Sep 2024
Nine Monthly Results Snapshot (Consolidated) - Dec'25
YoY Growth in nine months ended Dec 2025 is -2.31% vs 0.78% in Dec 2024
YoY Growth in nine months ended Dec 2025 is 41.61% vs 30.72% in Dec 2024
Annual Results Snapshot (Consolidated) - Mar'26
YoY Growth in year ended Mar 2026 is 9.13% vs -0.28% in Mar 2025
YoY Growth in year ended Mar 2026 is 76.30% vs 7.62% in Mar 2025
About Rashtriya Chemicals & Fertilizers Ltd.

Company Coordinates


