
Compare Rathi Bars with Similar Stocks
Dashboard
Weak Long Term Fundamental Strength with an average Return on Capital Employed (ROCE) of 5.12%
- Poor long term growth as Net Sales has grown by an annual rate of 8.29% and Operating profit at 0.23% over the last 5 years
- Low ability to service debt as the company has a high Debt to EBITDA ratio of 7.21 times
Negative results in Dec 25
Below par performance in long term as well as near term
Stock DNA
Iron & Steel Products
INR 34 Cr (Micro Cap)
10.00
25
0.00%
1.01
4.21%
0.41
Total Returns (Price + Dividend) 
Rathi Bars for the last several years.
Risk Adjusted Returns v/s
Returns Beta

News
Rathi Bars Ltd is Rated Strong Sell
Rathi Bars Ltd is rated Strong Sell by MarketsMOJO, with this rating last updated on 11 Feb 2025. However, the analysis and financial metrics presented here reflect the company’s current position as of 19 June 2026, providing investors with an up-to-date view of the stock’s fundamentals, returns, and technical outlook.
Read full news article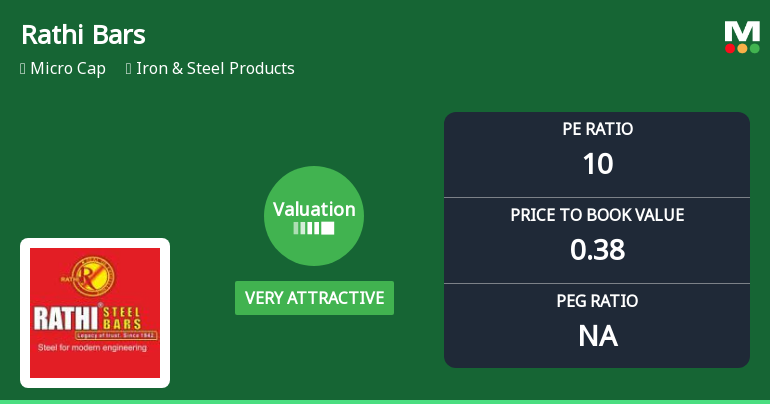
Rathi Bars Ltd Valuation Shifts to Very Attractive Amid Market Pressure
Rathi Bars Ltd, a micro-cap player in the Iron & Steel Products sector, has seen a notable shift in its valuation parameters, moving from an attractive to a very attractive rating. Despite a challenging market environment reflected in its share price decline and a strong sell mojo grade, the company’s price-to-earnings (P/E) and price-to-book value (P/BV) ratios suggest a compelling valuation relative to peers and historical averages.
Read full news article
Rathi Bars Ltd is Rated Strong Sell
Rathi Bars Ltd is rated Strong Sell by MarketsMOJO, with this rating last updated on 11 Feb 2025. However, the analysis and financial metrics discussed here reflect the company’s current position as of 21 May 2026, providing investors with an up-to-date perspective on the stock’s fundamentals, valuation, financial trends, and technical outlook.
Read full news article Announcements
Closure of Trading Window
24-Jun-2026 | Source : BSEIntimation of closure of Trading Window pursuant to SEBI (Prevention of Insider Trading) Regulation 2015 for the qurter ended June 30 2026
Announcement under Regulation 30 (LODR)-Newspaper Publication
29-May-2026 | Source : BSENewspaper publication pursunat to approval of the audited financial statement for the fy ended March 31 2026
Board Meeting Outcome for Outcome Of The Board Meeting Held On Thursday 28.05.2026 At 02.30 P.M.
28-May-2026 | Source : BSEOutcome of the Board Meeting held on Thursday 28.05.2026 at 02.30 P.m.
Corporate Actions

No Upcoming Board Meetings

No Dividend history available

No Splits history available

No Bonus history available

No Rights history available
Quality key factors
Valuation key factors
Technicals key factors
 Technical Indicator Scale: Bearish, Mildly Bearish, Sideways, Mildly Bullish, Bullish Turned
 Shareholding Snapshot : Mar 2026
Shareholding Compare (%holding)
Promoters
None
Held by 0 Schemes
Held by 0 FIIs
Pushpa Rathi (9.72%)
None
34.77%
Quarterly Results Snapshot (Standalone) - Dec'25 - QoQ

QoQ Growth in quarter ended Dec 2025 is -27.85% vs -5.45% in Sep 2025
QoQ Growth in quarter ended Dec 2025 is -27.84% vs 15.48% in Sep 2025
Half Yearly Results Snapshot (Standalone) - Sep'25

Growth in half year ended Sep 2025 is 4.38% vs -27.56% in Sep 2024
Growth in half year ended Sep 2025 is 16.03% vs -21.21% in Sep 2024
Nine Monthly Results Snapshot (Standalone) - Dec'25
YoY Growth in nine months ended Dec 2025 is -2.53% vs -24.80% in Dec 2024
YoY Growth in nine months ended Dec 2025 is 2.45% vs -12.81% in Dec 2024
Annual Results Snapshot (Standalone) - Mar'26
YoY Growth in year ended Mar 2026 is -25.73% vs -19.18% in Mar 2025
YoY Growth in year ended Mar 2026 is -548.25% vs -28.01% in Mar 2025
About Rathi Bars Ltd

Company Coordinates


