
Compare Rathi Steel with Similar Stocks
Dashboard
Falling Participation by Institutional Investors
- Institutional investors have decreased their stake by -2.31% over the previous quarter and collectively hold 8.78% of the company
- These investors have better capability and resources to analyse fundamentals of companies than most retail investors
Underperformed the market in the last 1 year
Stock DNA
Iron & Steel Products
INR 163 Cr (Micro Cap)
12.00
26
0.00%
0.28
8.59%
1.07
Total Returns (Price + Dividend) 
Latest dividend: 0.3 per share ex-dividend date: Sep-22-2011
Risk Adjusted Returns v/s
Returns Beta

News

Rathi Steel & Power Ltd Downgraded to Sell Amid Mixed Financial and Quality Signals
Rathi Steel & Power Ltd has seen its investment rating downgraded from Hold to Sell as of 2 June 2026, despite reporting outstanding financial results for the quarter ended March 2026. The downgrade reflects a complex interplay of factors including a marked improvement in financial trends, deteriorating quality metrics, valuation attractiveness, and weakening technical indicators, all of which investors should carefully consider.
Read full news article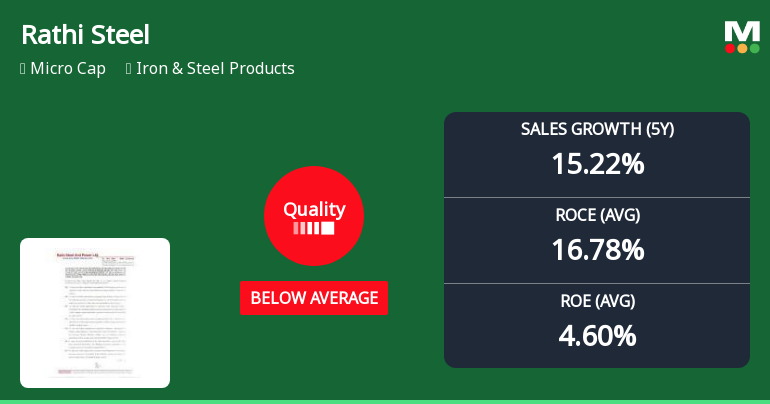
Rathi Steel & Power Ltd Downgraded to Sell as Quality Metrics Deteriorate
Rathi Steel & Power Ltd, a micro-cap player in the Iron & Steel Products sector, has seen its quality grade downgraded from Hold to Sell as of 2 June 2026, reflecting a notable deterioration in key business fundamentals including return ratios and consistency metrics. The company’s Mojo Score now stands at 48.0, signalling below-average quality compared to its peers.
Read full news article
Rathi Steel & Power Ltd Reports Outstanding Quarterly Performance Amid Market Challenges
Rathi Steel & Power Ltd has delivered an exceptional quarterly performance for the period ending March 2026, marking a significant turnaround in its financial trend. The company’s latest results reveal record-breaking sales and profitability metrics, signalling a robust recovery in the iron and steel products sector despite broader market headwinds.
Read full news article Announcements
Announcement under Regulation 30 (LODR)-Earnings Call Transcript
06-Jun-2026 | Source : BSETranscript of the Earning Call related to the Audited Financial Results for the Quarter and Financial Year ended March 31 2026
Trial Run For Hot Charging Of Mild Steel (MS) Billets For Manufacturing MS TMT Rebars
06-Jun-2026 | Source : BSETrial Run for Hot Charging of Mild Steel (MS) Billets for Manufacturing MS TMT Rebars
Announcement under Regulation 30 (LODR)-Analyst / Investor Meet - Outcome
03-Jun-2026 | Source : BSEAudio recording of the Earnings Conference Call related to the Audited Financial Results for the quarter and Financial Year ended March 31 2026
Corporate Actions

No Upcoming Board Meetings

Rathi Steel & Power Ltd has declared 3% dividend, ex-date: 22 Sep 11

No Splits history available

No Bonus history available

No Rights history available
Quality key factors
Valuation key factors
Technicals key factors
 Technical Indicator Scale: Bearish, Mildly Bearish, Sideways, Mildly Bullish, Bullish Turned
 Shareholding Snapshot : Mar 2026
Shareholding Compare (%holding)
Non Institution
None
Held by 1 Schemes (0.8%)
Held by 5 FIIs (2.7%)
Pcr Holdings Private Limited (26.41%)
Asg Trading Pvt Ltd. (6.53%)
30.57%
Quarterly Results Snapshot (Standalone) - Mar'26 - YoY

YoY Growth in quarter ended Mar 2026 is 63.43% vs 26.38% in Mar 2025
YoY Growth in quarter ended Mar 2026 is 96.05% vs -81.12% in Mar 2025
Half Yearly Results Snapshot (Standalone) - Sep'25
Growth in half year ended Sep 2025 is 25.06% vs -8.82% in Sep 2024

Growth in half year ended Sep 2025 is -63.55% vs 267.56% in Sep 2024
Nine Monthly Results Snapshot (Standalone) - Dec'25
YoY Growth in nine months ended Dec 2025 is 33.38% vs -5.58% in Dec 2024
YoY Growth in nine months ended Dec 2025 is -46.65% vs 197.95% in Dec 2024
Annual Results Snapshot (Standalone) - Mar'26
YoY Growth in year ended Mar 2026 is 42.31% vs 2.09% in Mar 2025
YoY Growth in year ended Mar 2026 is -7.81% vs -40.71% in Mar 2025
About Rathi Steel & Power Ltd

Company Coordinates


