
Compare Ratnamani Metals with Similar Stocks
Dashboard
High Management Efficiency with a high ROE of 16.14%
Company has a Debt to Equity ratio (avg) of 0.01 times
Poor long term growth as Net Sales has grown by an annual rate of 14.40% and Operating profit at 13.08% over the last 5 years
Negative results in Mar 26
With ROE of 11.9, it has a Very Expensive valuation with a 4.4 Price to Book Value
Stock DNA
Iron & Steel Products
INR 18,277 Cr (Small Cap)
37.00
26
0.54%
-0.10
11.93%
4.46
Total Returns (Price + Dividend) 
Latest dividend: 13.999999999999998 per share ex-dividend date: Sep-02-2025
Risk Adjusted Returns v/s
Returns Beta

News

Ratnamani Metals & Tubes Ltd Sees Technical Momentum Shift Amid Mixed Market Signals
Ratnamani Metals & Tubes Ltd, a small-cap player in the Iron & Steel Products sector, has experienced a nuanced shift in its technical momentum, moving from a bullish to a mildly bullish trend. Despite a recent day decline of 2.64%, the stock’s technical indicators present a complex picture, with mixed signals from MACD, RSI, Bollinger Bands, and moving averages, suggesting cautious optimism among investors.
Read full news article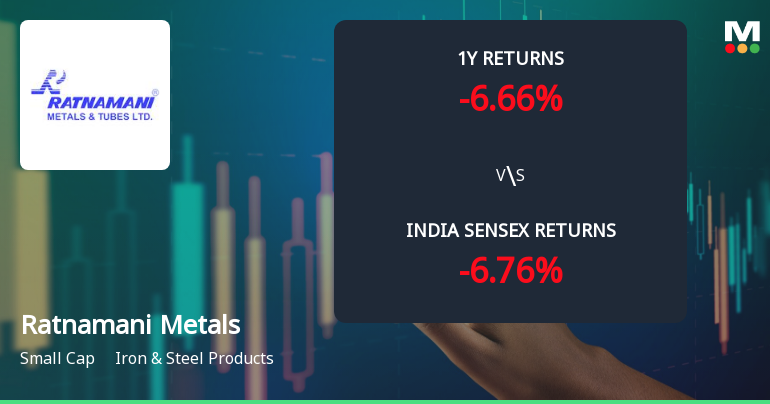
Ratnamani Metals & Tubes Ltd Technical Momentum Shifts Signal Bullish Outlook
Ratnamani Metals & Tubes Ltd has experienced a notable shift in technical momentum, moving from a mildly bullish stance to a more confident bullish trend across key indicators. This technical upgrade, coupled with strong price performance relative to the Sensex, signals renewed investor interest in the iron and steel products company.
Read full news article
Ratnamani Metals & Tubes Ltd is Rated Hold by MarketsMOJO
Ratnamani Metals & Tubes Ltd is rated 'Hold' by MarketsMOJO, with this rating last updated on 04 May 2026. However, the analysis and financial metrics discussed here reflect the stock's current position as of 11 July 2026, providing investors with an up-to-date view of the company’s fundamentals, returns, and market standing.
Read full news article Announcements
Ratnamani Metals & Tubes Limited - Other General Purpose
13-Nov-2019 | Source : NSERatnamani Metals & Tubes Limited has informed the Exchange that Submission of disclosure under Regulation 23(9) of the SEBI (Listing Obligations and Disclosure Requirements) Regulations, 2015.
Ratnamani Metals & Tubes Limited - Analysts/Institutional Investor Meet/Con. Call Updates
04-Nov-2019 | Source : NSERatnamani Metals & Tubes Limited has informed the Exchange regarding Analysts/Institutional Investor Meet/Con. Call Updates
Ratnamani Metals & Tubes Limited - Updates
31-Oct-2019 | Source : NSERatnamani Metals & Tubes Limited has informed the Exchange regarding 'Publication of Extract of Unaudited Financial Results (Standalone and Consolidated) for the Quarter and Half Year ended on 30th September, 2019'.
Corporate Actions

No Upcoming Board Meetings

Ratnamani Metals & Tubes Ltd has declared 500% dividend, ex-date: 11 Aug 26

Ratnamani Metals & Tubes Ltd has announced 2:10 stock split, ex-date: 06 Nov 08

Ratnamani Metals & Tubes Ltd has announced 1:2 bonus issue, ex-date: 30 Jun 22

No Rights history available
Quality key factors
Valuation key factors
Technicals key factors
 Technical Indicator Scale: Bearish, Mildly Bearish, Sideways, Mildly Bullish, Bullish Turned
 Shareholding Snapshot : Jun 2026
Shareholding Compare (%holding)
Promoters
None
Held by 19 Schemes (19.1%)
Held by 109 FIIs (10.72%)
M N Sanghvi Family Trust (trustees, Prakash M. Sanghvi & Jayanti Mishrimal Sanghvi) (52.16%)
Icici Prudential Multi-asset Fund (4.89%)
8.61%
Quarterly Results Snapshot (Consolidated) - Mar'26 - QoQ

QoQ Growth in quarter ended Mar 2026 is 1.78% vs -10.56% in Dec 2025
QoQ Growth in quarter ended Mar 2026 is -4.73% vs -19.36% in Dec 2025
Half Yearly Results Snapshot (Consolidated) - Sep'25
Growth in half year ended Sep 2025 is 8.74% vs -6.55% in Sep 2024
Growth in half year ended Sep 2025 is 30.42% vs -30.97% in Sep 2024
Nine Monthly Results Snapshot (Consolidated) - Dec'25
YoY Growth in nine months ended Dec 2025 is -1.79% vs -2.58% in Dec 2024
YoY Growth in nine months ended Dec 2025 is 12.19% vs -21.78% in Dec 2024
Annual Results Snapshot (Consolidated) - Mar'26

YoY Growth in year ended Mar 2026 is -13.35% vs 2.52% in Mar 2025
YoY Growth in year ended Mar 2026 is -11.29% vs -12.65% in Mar 2025
About Ratnamani Metals & Tubes Ltd

Company Coordinates


