
Compare RattanIndia Pow. with Similar Stocks
Dashboard
Weak Long Term Fundamental Strength with a -6.65% CAGR growth in Operating Profits over the last 5 years
- Low ability to service debt as the company has a high Debt to EBITDA ratio of 9.15 times
- The company has been able to generate a Return on Equity (avg) of 1.19% signifying low profitability per unit of shareholders funds
The company has declared Negative results for the last 4 consecutive quarters
88.65% of Promoter Shares are Pledged
Underperformed the market in the last 1 year
Total Returns (Price + Dividend) 
RattanIndia Pow. for the last several years.
Risk Adjusted Returns v/s
Returns Beta

News

RattanIndia Power Ltd is Rated Strong Sell
RattanIndia Power Ltd is rated Strong Sell by MarketsMOJO, with this rating last updated on 25 August 2025. However, the analysis and financial metrics discussed here reflect the stock's current position as of 14 June 2026, providing investors with an up-to-date perspective on the company’s performance and outlook.
Read full news article
RattanIndia Power Ltd is Rated Strong Sell
RattanIndia Power Ltd is rated Strong Sell by MarketsMOJO, with this rating last updated on 25 Aug 2025. However, the analysis and financial metrics discussed here reflect the stock’s current position as of 03 June 2026, providing investors with an up-to-date view of the company’s fundamentals, valuation, financial trends, and technical outlook.
Read full news article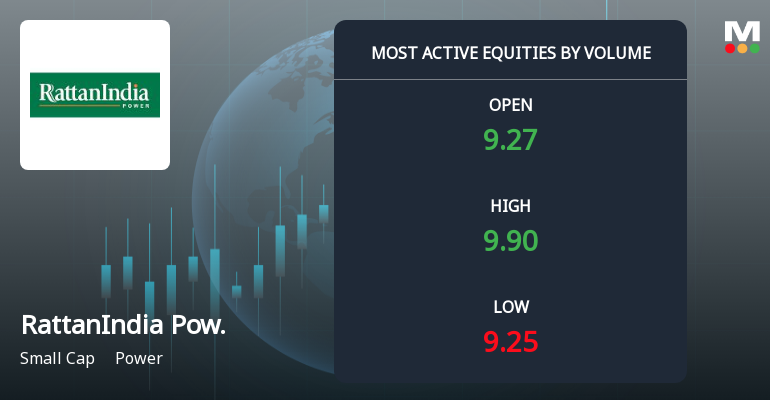
RattanIndia Power Ltd Sees Exceptional Volume Surge Amid Strong Sell Rating
RattanIndia Power Ltd (RTNPOWER) has emerged as one of the most actively traded stocks today, registering a remarkable surge in volume alongside notable price appreciation. The power sector small-cap has outperformed its peers and broader indices, signalling heightened investor interest and potential accumulation despite a recent downgrade to a Strong Sell rating.
Read full news article Announcements
Compliances-Reg.24(A)-Annual Secretarial Compliance
19-May-2026 | Source : BSEAnnual Secretarial Compliance Report of RattanIndia Power Limited for the year ended March 31 2026
Board Meeting Outcome for Audited Financial Results For The Quarter And Financial Year Ended On March 31 2026
07-May-2026 | Source : BSEAudited financial results for the quarter and financial year ended on March 31 2026
Earnings Update Of Rattanindia Power Limited For The Financial Year Ended March 31 2026.
07-May-2026 | Source : BSEEarnings Update
Corporate Actions

No Upcoming Board Meetings

No Dividend history available

No Splits history available

No Bonus history available

No Rights history available
Quality key factors
Valuation key factors
Technicals key factors
 Technical Indicator Scale: Bearish, Mildly Bearish, Sideways, Mildly Bullish, Bullish Turned
 Shareholding Snapshot : Mar 2026
Shareholding Compare (%holding)
Non Institution
88.652
Held by 5 Schemes (0.15%)
Held by 78 FIIs (5.13%)
Rr Infralands Private Limited (24.06%)
Power Finance Corporation Ltd (4.38%)
40.17%
Quarterly Results Snapshot (Consolidated) - Mar'26 - QoQ

QoQ Growth in quarter ended Mar 2026 is 8.20% vs 11.36% in Dec 2025
QoQ Growth in quarter ended Mar 2026 is -21.05% vs 271.98% in Dec 2025
Half Yearly Results Snapshot (Consolidated) - Sep'25
Growth in half year ended Sep 2025 is -8.58% vs -1.79% in Sep 2024
Growth in half year ended Sep 2025 is -148.73% vs 107.75% in Sep 2024
Nine Monthly Results Snapshot (Consolidated) - Dec'25
YoY Growth in nine months ended Dec 2025 is -6.13% vs -4.18% in Dec 2024
YoY Growth in nine months ended Dec 2025 is -90.00% vs 105.43% in Dec 2024
Annual Results Snapshot (Consolidated) - Mar'26
YoY Growth in year ended Mar 2026 is -8.91% vs -2.38% in Mar 2025

YoY Growth in year ended Mar 2026 is -76.37% vs -97.51% in Mar 2025
About RattanIndia Power Ltd

Company Coordinates


