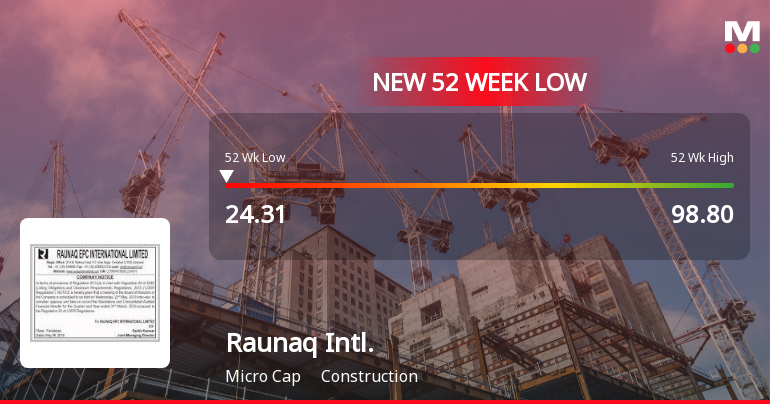
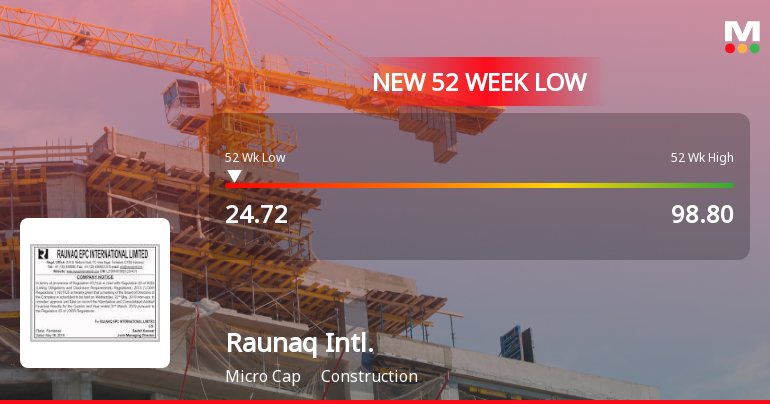
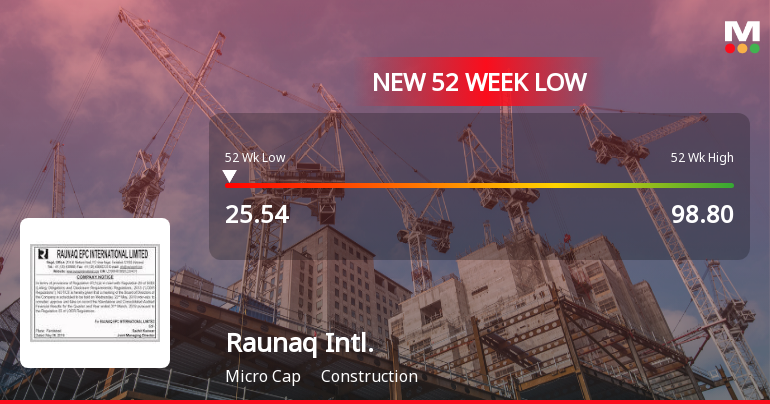
Raunaq Intl.

  • Market Cap: Micro Cap
  • Industry: Construction
  • ISIN: INE523K01012
  • NSEID:
  • BSEID: 537840
INR
29.85
0.00 (0.00%)
BSENSE

Aug 04, 03:30 PM

BSE+NSE Vol: 100

  • Price Points
  • Score
  • Mojo Parameters
  • Total Return
  • News and Corporate Actions
  • Key factors
  • Shareholding
  • Financials
  • CompanyCV
stock-recommendationUpcoming Result: Raunaq Intl. will declare its result soon on 14 Aug 2026
stock-summaryPrice Point
High/Low

1Day

52 Week

Valuation
Technical
Day's Volume

CASH

100 (42.86%) Volume

Shareholding (Jun 2026)

FII

0.00%

Held by 0 FIIs

DII

0.07%

Held by 0 DIIs

Promoter

52.28%

Why is Raunaq International Ltd falling/rising?

03-Aug-2026

As of 03-Aug, Raunaq International Ltd's stock price is at 29.85, unchanged from the previous session, and has declined 55.40% over the past year, significantly underperforming the broader market. The company faces financial challenges, including operating losses and a weak ability to service its debt, contributing to negative investor sentiment and trading activity.

As of 03-Aug, Raunaq International Ltd's stock price is currently at 29.85, showing no change from the previous trading session. The stock has been underperforming significantly, with a decline of 55.40% over the past year, while the broader market, represented by the Sensex, has only fallen by 2.43% in the same period. <BR><BR>In the short term, the stock has also shown a negative performance, with a 1-week decline of 0.50%, contrasting with a 2.35% increase in the Sensex. Additionally, the stock has underperformed its sector by 1.04% today. The trading activity has been erratic, with the stock not trading on 2 out of the last 20 days, indicating a lack of investor interest. This is further evidenced by a significant drop in delivery volume, which fell by 96.14% compared to the 5-day average.<BR><BR>The company's financial health is concerning, as it has reported operating losses and a weak long-term fundamental strength. The operating profit has only grown at an annual rate of 10.79% over the last five years, and the company has a poor EBIT to Interest ratio of -3.10, indicating difficulties in servicing its debt. The latest quarterly results reflect a troubling trend, with net sales at their lowest of Rs 8.24 crore and a negative EBITDA of Rs -1.26 crore. <BR><BR>Overall, the combination of poor financial performance, declining investor participation, and negative market sentiment contributes to the stock's downward trajectory.

View full answer

How big is Raunaq Intl.?

11-Jun-2026

As of 10th June, Raunaq International Ltd has a market capitalization of 9.00 Cr, with Net Sales of 5.77 Cr and a Net Profit loss of 2.71 Cr over the latest four quarters. Shareholder's Funds were 13.54 Cr and Total Assets were 32.56 Cr as of March 2021.

As of 10th June, Raunaq International Ltd has a market capitalization of 9.00 Cr, categorizing it as a Micro Cap company.<BR><BR>In the latest four quarters, the company reported Net Sales of 5.77 Cr. However, it experienced a loss of 2.71 Cr in Net Profit during the same period.<BR><BR>The latest annual period for the balance sheet is March 2021, where Shareholder's Funds were recorded at 13.54 Cr and Total Assets amounted to 32.56 Cr.

View full answer

Who are in the management team of Raunaq Intl.?

11-Jun-2026

The management team of Raunaq International includes Surinder P Kanwar (Chairman & Managing Director), Sanjeev Kumar, Rajiv Chandra Rastogi, Naresh Kumar Verma, and Preeti Goel, serving in various director roles.

The management team of Raunaq International includes the following individuals:<BR><BR>1. **Surinder P Kanwar** - Chairman & Managing Director<BR>2. **Sanjeev Kumar** - Independent Non-Executive Director<BR>3. **Rajiv Chandra Rastogi** - Independent Non-Executive Director<BR>4. **Naresh Kumar Verma** - Non-Executive & Non-Independent Director<BR>5. **Preeti Goel** - Independent Non-Executive Director<BR><BR>If you need more information about any specific member or their roles, feel free to ask!

View full answer

Who are the peers of the Raunaq Intl.?

11-Jun-2026

Raunaq Intl.'s peers include Shashijit Infra., Julien Agro, P B A Infra., Ishaan Infrastru, Shelter Infra., Setubandhan Inf., Transwind Infra., and Ishan Internat. Most peers exhibit below-average management risk and growth, with Ishaan Infrastru showing the highest 1-year return at 109.50%, while Raunaq Intl. has a return of -47.19%.

Peers: The peers of Raunaq Intl. are Shashijit Infra., Julien Agro, P B A Infra., Ishaan Infrastru, Shelter Infra, Setubandhan Inf., Transwind Infra., and Ishan Internat.<BR><BR>Quality Snapshot: Below Average management risk is observed at Shashijit Infra., Raunaq Intl., Shelter Infra., Setubandhan Inf., Transwind Infra., and Ishan Internat., while Average management risk is found at Julien Agro. P B A Infra. and Ishaan Infrastru do not qualify for management risk assessment. Growth is Below Average for Shashijit Infra., Raunaq Intl., Shelter Infra., Setubandhan Inf., Ishan Internat., and the rest, while Julien Agro shows Average growth. P B A Infra. and Ishaan Infrastru do not qualify for growth assessment. Capital Structure is rated as Below Average for Shashijit Infra., Raunaq Intl., Shelter Infra., Setubandhan Inf., Ishan Internat., and the rest, while Julien Agro has a Good capital structure. P B A Infra. and Ishaan Infrastru do not qualify for capital structure assessment.<BR><BR>Return Snapshot: Ishaan Infrastru has the highest 1-year return at 109.50%, while Shashijit Infra. has the lowest at -62.22%. Raunaq Intl.'s 1-year return of -47.19% is better than Shashijit Infra.'s but worse than Ishaan Infrastru's. Additionally, P B A Infra., Ishaan Infrastru, and Setubandhan Inf. have negative six-month returns.

View full answer

What does Raunaq Intl. do?

10-Jun-2026

Raunaq International Ltd, established in 1965, operates in the engineering contracting sector, focusing on infrastructure and industrial projects in India. As of March 2026, it reported net sales of 8 Cr and a net loss of 1 Cr, with a market cap of INR 9 Cr.

Overview: <BR>Raunaq International Ltd is engaged in the engineering contracting business within the construction industry, specifically serving core infrastructural and industrial sectors in India.<BR><BR>History: <BR>Raunaq International Ltd was established in 1965 and was formerly known as 'Raunaq EPC International Limited'. The company name was changed to "Raunaq International Limited" effective January 10, 2024. The most recent quarterly results reported net sales and net profit for the period ending March 2026.<BR><BR>Financial Snapshot: <BR>Net Sales: 8 Cr (Quarterly Results - Mar 2026) <BR>Net Profit: -1 Cr (Quarterly Results - Mar 2026) <BR>Market Cap: INR 9 Cr (Micro Cap) <BR><BR>Key Metrics: <BR>P/E: N/A <BR>Industry P/E: 32 <BR>Dividend Yield: 0.00% <BR>Debt-Equity: 0.35 <BR>Return on Equity: 1.15% <BR>Price to Book: 1.18 <BR><BR>Contact Details: <BR>Address: 20 K M Mathura Road, P O Amar Nagar Faridabad Haryana : 121003 <BR>Tel: 91-129-4288888 <BR>Email: info@raunaqinti.com <BR>Website: http://www.raunaqinternational.com

View full answer

Should I buy, sell or hold Raunaq International Ltd?

30-May-2026

When is the next results date for Raunaq International Ltd?

12-May-2026

The next results date for Raunaq International Ltd is 27 May 2026.

The next results date for Raunaq International Ltd is scheduled for 27 May 2026.

View full answer

Are Raunaq International Ltd latest results good or bad?

12-Feb-2026

Raunaq International Ltd's latest results are concerning, showing a net loss of ₹3.08 crores in Q3 FY26, a 422.03% decline from the previous quarter, despite a year-on-year revenue growth of 128.46%. The company's operational issues and bearish stock indicators suggest significant challenges ahead.

Raunaq International Ltd's latest results indicate significant challenges. In Q3 FY26, the company reported a net loss of ₹3.08 crores, which is a drastic decline of 422.03% compared to the previous quarter. This loss is compounded by a deeply negative operating margin of -269.72%, highlighting severe operational issues.<BR><BR>While the half-yearly revenue showed impressive growth of 128.46% year-on-year, the quarterly performance was alarming, with net sales dropping to ₹1.09 crores, a decrease of 20.44% from the previous quarter and a staggering 74.11% year-on-year decline. This stark contrast between half-yearly gains and quarterly losses suggests that the company is facing serious execution challenges in its engineering contracting business.<BR><BR>Furthermore, the stock's technical indicators have turned bearish, trading below all major moving averages, and the company's Mojo Score of 32 out of 100 places it firmly in "SELL" territory. The overall assessment reflects a mixed outlook, with strong revenue growth overshadowed by operational turmoil and deteriorating profitability.<BR><BR>In summary, the latest results for Raunaq International Ltd are concerning, indicating a troubling trajectory that investors should closely monitor.

View full answer

How has been the historical performance of Raunaq Intl.?

02-Dec-2025

Raunaq Intl. has experienced a significant decline in financial performance, with net sales dropping from 92.82 Cr in Mar'19 to 5.77 Cr in Mar'23, and consistent negative operating profits. Earnings per share fell from a profit of 3.27 in Mar'17 to a loss of -7.13 in Mar'23, indicating ongoing financial struggles.

Answer:<BR>The historical performance of Raunaq Intl. shows a significant decline in net sales over the years, dropping from 92.82 Cr in Mar'19 to just 5.77 Cr in Mar'23. The total operating income followed a similar trend, decreasing from 61.68 Cr in Mar'20 to 5.77 Cr in Mar'23. The company has consistently reported negative operating profits, with an operating profit of -4.26 Cr in Mar'23 compared to -0.64 Cr in Mar'18. The profit before tax has also been negative, reaching -2.83 Cr in Mar'23, and the profit after tax was -2.38 Cr in the same period. Earnings per share have deteriorated significantly, with a loss of -7.13 in Mar'23 compared to a profit of 3.27 in Mar'17. The company's total liabilities have decreased from 101.45 Cr in Mar'19 to 32.56 Cr in Mar'21, while total assets have also declined from 101.54 Cr in Mar'18 to 32.56 Cr in Mar'21. Cash flow from operating activities has shown some recovery with 1.00 Cr in Mar'21, but the overall cash flow remains weak.<BR><BR>Breakdown:<BR>Raunaq Intl.'s financial performance has seen a drastic decline over the years, particularly in net sales, which fell from 92.82 Cr in Mar'19 to 5.77 Cr in Mar'23. The total operating income mirrored this decline, dropping from 61.68 Cr in Mar'20 to the same 5.77 Cr in Mar'23. Operating profits have remained negative, with a loss of -4.26 Cr in Mar'23, while profit before tax also showed a negative trend at -2.83 Cr. The profit after tax was reported at -2.38 Cr in Mar'23, indicating ongoing financial struggles. Earnings per share have plummeted, reflecting a loss of -7.13 in Mar'23, down from a profit of 3.27 in Mar'17. The company's total liabilities decreased from 101.45 Cr in Mar'19 to 32.56 Cr in Mar'21, alongside a reduction in total assets from 101.54 Cr in Mar'18 to the same 32.56 Cr in Mar'21. Despite a slight improvement in cash flow from operating activities, which was 1.00 Cr in Mar'21, the overall cash flow situation remains concerning.

View full answer

Is Raunaq Intl. overvalued or undervalued?

18-Nov-2025

As of November 17, 2025, Raunaq International is considered undervalued with a PE ratio of 8.22 and strong performance, significantly lower than peers like Altius Telecom, indicating an attractive investment opportunity.

As of 17 November 2025, Raunaq International's valuation grade has moved from very attractive to attractive, indicating a shift in perception regarding its market position. The company is currently considered undervalued. Key ratios supporting this assessment include a PE ratio of 8.22, an EV to EBITDA of 21.54, and a ROE of 26.46%. <BR><BR>In comparison to its peers, Raunaq International's PE ratio is significantly lower than that of Altius Telecom, which stands at 51.5, highlighting a substantial valuation gap. Additionally, while Raunaq's EV to Sales ratio is 0.64, peers like Embassy Off.REIT are categorized as very expensive with an EV to EBITDA of 21.56. Notably, the company has shown strong performance over the past three years with a return of 162.82%, contrasting with the Sensex's 37.57% return in the same period, further reinforcing its undervalued status.

View full answer

Who are the top shareholders of the Raunaq Intl.?

17-Jul-2025

The top shareholders of Raunaq International include Surinder Paul Kanwar, who holds 43.87%, and Strategic Capital Partners Private Limited, with 7.34%. Individual investors collectively own 31.89%, while there are no mutual funds or foreign institutional investors involved.

The top shareholders of Raunaq International include the promoters, who hold the majority of the shares. The promoter with the highest holding is Surinder Paul Kanwar, who owns 43.87% of the company. Additionally, the highest public shareholder is Strategic Capital Partners Private Limited, with a stake of 7.34%. Individual investors collectively hold 31.89% of the shares. There are no mutual funds or foreign institutional investors holding shares in the company.

View full answer

What is the technical trend for Raunaq Intl.?

09-Jun-2025

As of March 25, 2025, Raunaq Intl. shows a mildly bullish trend overall, supported by daily moving averages and monthly indicators, despite mixed signals from weekly MACD, RSI, and other metrics indicating bearish pressure.

As of 25 March 2025, the technical trend for Raunaq Intl. has changed from bullish to mildly bullish. The weekly MACD is mildly bearish, while the monthly MACD remains bullish, indicating mixed signals across time frames. The weekly RSI is bearish, suggesting downward pressure, but the monthly RSI shows no signal, indicating indecision. Moving averages on the daily chart are mildly bullish, supporting a positive short-term outlook. The Bollinger Bands are sideways on the weekly chart but mildly bullish on the monthly, reflecting potential for upward movement. The KST and Dow Theory both indicate mildly bearish trends on the weekly but are bullish on the monthly, further contributing to the mixed sentiment. Overall, the current stance is mildly bullish, driven primarily by the daily moving averages and monthly indicators, despite the bearish signals on the weekly charts.

View full answer
iScoreScore
Click here to find our call on this stock
Strong Sell
Sell
Hold
Buy
Strong Buy

Dashboard

1

With a Operating Losses, the company has a Weak Long Term Fundamental Strength

  • Poor long term growth as Operating profit has grown by an annual rate 10.79% of over the last 5 years
  • Company's ability to service its debt is weak with a poor EBIT to Interest (avg) ratio of -3.10
2

Flat results in Mar 26

3

Risky - Negative EBITDA

stock-summaryMojo Parameters

Mojo Parameters

Loading Valuation Snapshot...

Stock DNA

stock-summary
Industry

Construction

stock-summary
Market cap

INR 10 Cr (Micro Cap)

stock-summary
P/E

NA (Loss Making)

stock-summary
Industry P/E

57

stock-summary
Dividend Yield

0.00%

stock-summary
Debt Equity

0.35

stock-summary
Return on Equity

1.15%

stock-summary
Price to Book

1.28

Revenue and Profits:
Net Sales:
8 Cr
(Quarterly Results - Mar 2026)
Net Profit:
-1 Cr
stock-summaryTotal Returns
Total Returns (Price + Dividend) stock-summary
Dividend Yield (0%)
TimePeriod
Price Return
Dividend Return
Total Return
3 Months
-33.74%
0%
-33.74%
6 Months
0%
0%
0.0%
1 Year
0%
0%
0.0%
2 Years
0%
0%
0.0%
3 Years
0%
0%
0.0%
4 Years
0%
0%
0.0%
5 Years
20.12%
0%
20.12%

Latest dividend: 1.2 per share ex-dividend date: Jul-26-2016

Risk Adjusted Returns v/s stock-summary
Returns Beta
Icon
Beta has not been calculated since enough price history is not available
stock-summaryNews & Corporate Actions

Announcements stock-summary

Shareholder Meeting / Postal Ballot-Outcome of AGM

31-Jul-2026 | Source : BSE

We hereby enclose the gist of the proceedings of the 61st Annual General Meeting of the Company held on 31st July2026. You are requested to take the same on your records.

Intimation Under Regulation 30 Read With Schedule III Of The SEBI (Listing Obligations And Disclosure Requirements) Regulations 2015

31-Jul-2026 | Source : BSE

We refer to our letter dated April 20 2026 made pursuant to Regulation 30 read with Schedule III of the SEBI (Listing Obligations and Disclosure Requirements) Regulations 2015 (the Regulations). Pursuant to Regulation 30 read with Schedule III of the Regulations we hereby inform you that Mr. Surinder Paul Kanwar Chairman and Managing Director of the Company has intimated the Company that the appeal dated 15.04.2026 filed by him under Section 11 of the Passports Act 1967 against the revocation of his passport has been dismissed by an Order dated July 23 2026 passed by the Joint Secretary (PSP) & Chief Passport Officer (CPO) Ministry of External Affairs which was received by him on July 29 2026. The Company will keep you informed you of any material developments in this matter as and when required in accordance with applicable laws and regulations. You are requested to kindly take the same on record.

Intimation Under Regulation 30 Read With Schedule III Of The SEBI (Listing Obligations And Disclosure Requirements) Regulations 2015

31-Jul-2026 | Source : BSE

Pursuant to the Regulation 30 of the SEBI (Listing Obligations and Disclosure Requirements)Regulations 2015 (the Regulations) this is to inform that the members of the Company at their Annual General Meeting held on Friday July 31 2026 have considered and approved the business as enclosed. You are requested to kindly take the same on records.

Corporate Actions stock-summary

stock-summary
BOARD MEETING

14 Aug 2026

stock-summary
DIVIDEND

Raunaq International Ltd has declared 12% dividend, ex-date: 26 Jul 16

stock-summary
SPLITS

No Splits history available

stock-summary
BONUS

No Bonus history available

stock-summary
RIGHTS

No Rights history available

stock-summaryKey Factors

Quality key factors stock-summary

Factor
Value
Sales Growth (5y)
29.57%
EBIT Growth (5y)
10.79%
EBIT to Interest (avg)
-3.10
Debt to EBITDA (avg)
Negative Net Debt
Net Debt to Equity (avg)
0.35
Sales to Capital Employed (avg)
1.26
Tax Ratio
52.17%
Dividend Payout Ratio
0
Pledged Shares
0
Institutional Holding
0.07%
ROCE (avg)
-52.55%
ROE (avg)
3.39%

Valuation key factors

Factor
Value
P/E Ratio
NA (Loss Making)
Industry P/E
57
Price to Book Value
1.27
EV to EBIT
-9.80
EV to EBITDA
-10.11
EV to Capital Employed
1.20
EV to Sales
0.35
PEG Ratio
NA
Dividend Yield
NA
ROCE (Latest)
-12.24%
ROE (Latest)
1.15%

Technicals key factors

Indicator
Weekly
Monthly
MACD
Bearish
Bearish
RSI
No Signal
No Signal
Bollinger Bands
Bearish
Mildly Bearish
Moving Averages
Bearish (Daily)
KST
Bearish
Mildly Bearish
Dow Theory
Mildly Bearish
Mildly Bearish
OBV
Mildly Bearish
Mildly Bearish
stock-summary Technical Indicator Scale: Bearish, Mildly Bearish, Sideways, Mildly Bullish, Bullish  Turned 
stock-summaryShareholding
Shareholding Snapshot : Jun 2026stock-summary
Shareholding Compare (%holding) stock-summary
Majority shareholders

Promoters

Pledged Promoter Holdings

None

Mutual Funds

Held by 0 Schemes

FIIs

Held by 0 FIIs

Promoter with highest holding

Mr. Surinder Paul Kanwar (43.87%)

Highest Public shareholder

Strategic Capital Partners Private Limited (7.34%)

Individual Investors Holdings

31.79%

stock-summaryFinancial
[
  {
    "link": "quarterly",
    "btn_text": "All Quarterly Results",
    "header": "Quarterly Results Snapshot (Standalone) - Mar'26 - QoQ",
    "rhs": [
      {
        "prefix": "Net Sales ",
        "suffix": "QoQ Growth in quarter ended Mar 2026 is -5.50% vs -8.98% in Dec 2025",
        "dir": 1
      },
      {
        "prefix": "Standalone Net Profit ",
        "suffix": "QoQ Growth in quarter ended Mar 2026 is -126.00% vs -160.24% in Dec 2025",
        "dir": 1
      }
    ],
    "table": {
      "header": [
        "Mar'26",
        "Dec'25",
        "Change(%)"
      ],
      "body": [
        {
          "field": "Net Sales",
          "val1": "8.24",
          "val2": "8.72",
          "chgp": "-5.50%",
          "chgp_class": "negative"
        },
        {
          "field": "Operating Profit (PBDIT) excl Other Income",
          "val1": "-1.12",
          "val2": "-0.92",
          "chgp": "-21.74%",
          "chgp_class": "negative"
        },
        {
          "field": "Interest",
          "val1": "0.11",
          "val2": "0.09",
          "chgp": "22.22%",
          "chgp_class": "negative"
        },
        {
          "field": "Exceptional Items",
          "val1": "0.00",
          "val2": "0.00",
          "chgp": "",
          "chgp_class": "neutral"
        },
        {
          "field": "Standalone Net Profit",
          "val1": "-1.13",
          "val2": "-0.50",
          "chgp": "-126.00%",
          "chgp_class": "negative"
        },
        {
          "field": "Operating Profit Margin (Excl OI)",
          "val1": "-13.59%",
          "val2": "-10.55%",
          "chgp": "-3.04%",
          "chgp_class": "negative"
        }
      ]
    }
  },
  {
    "link": "half-yearly",
    "btn_text": "All Half Yearly Results",
    "header": "Half Yearly Results Snapshot (Standalone) - Sep'25",
    "rhs": [
      {
        "prefix": "Net Sales ",
        "suffix": " Growth in half year ended Sep 2025 is 186.21% vs 560.40% in Sep 2024",
        "dir": -1
      },
      {
        "prefix": "Standalone Net Profit ",
        "suffix": " Growth in half year ended Sep 2025 is 290.91% vs 2.33% in Sep 2024",
        "dir": 1
      }
    ],
    "table": {
      "header": [
        "Sep'25",
        "Sep'24",
        "Change(%)"
      ],
      "body": [
        {
          "field": "Net Sales",
          "val1": "19.09",
          "val2": "6.67",
          "chgp": "186.21%",
          "chgp_class": "positive"
        },
        {
          "field": "Operating Profit (PBDIT) excl Other Income",
          "val1": "0.78",
          "val2": "0.31",
          "chgp": "151.61%",
          "chgp_class": "positive"
        },
        {
          "field": "Interest",
          "val1": "0.16",
          "val2": "0.09",
          "chgp": "77.78%",
          "chgp_class": "negative"
        },
        {
          "field": "Exceptional Items",
          "val1": "0.00",
          "val2": "0.00",
          "chgp": "",
          "chgp_class": "neutral"
        },
        {
          "field": "Standalone Net Profit",
          "val1": "1.72",
          "val2": "0.44",
          "chgp": "290.91%",
          "chgp_class": "positive"
        },
        {
          "field": "Operating Profit Margin (Excl OI)",
          "val1": "4.09%",
          "val2": "4.65%",
          "chgp": "-0.56%",
          "chgp_class": "negative"
        }
      ]
    }
  },
  {
    "link": "nine-monthly",
    "btn_text": "All Nine Monthly Results",
    "header": "Nine Monthly Results Snapshot (Standalone) - Dec'25",
    "rhs": [
      {
        "prefix": "Net Sales ",
        "suffix": "YoY Growth in nine months ended Dec 2025 is 166.89% vs 287.36% in Dec 2024",
        "dir": -1
      },
      {
        "prefix": "Standalone Net Profit ",
        "suffix": "YoY Growth in nine months ended Dec 2025 is 82.09% vs 6,600.00% in Dec 2024",
        "dir": -1
      }
    ],
    "table": {
      "header": [
        "Dec'25",
        "Dec'24",
        "Change(%)"
      ],
      "body": [
        {
          "field": "Net Sales",
          "val1": "27.81",
          "val2": "10.42",
          "chgp": "166.89%",
          "chgp_class": "positive"
        },
        {
          "field": "Operating Profit (PBDIT) excl Other Income",
          "val1": "-0.14",
          "val2": "0.24",
          "chgp": "-158.33%",
          "chgp_class": "negative"
        },
        {
          "field": "Interest",
          "val1": "0.25",
          "val2": "0.10",
          "chgp": "150.00%",
          "chgp_class": "negative"
        },
        {
          "field": "Exceptional Items",
          "val1": "0.00",
          "val2": "0.00",
          "chgp": "",
          "chgp_class": "neutral"
        },
        {
          "field": "Standalone Net Profit",
          "val1": "1.22",
          "val2": "0.67",
          "chgp": "82.09%",
          "chgp_class": "positive"
        },
        {
          "field": "Operating Profit Margin (Excl OI)",
          "val1": "-0.50%",
          "val2": "2.30%",
          "chgp": "-2.80%",
          "chgp_class": "negative"
        }
      ]
    }
  },
  {
    "link": "annual",
    "btn_text": "All Annual Results",
    "header": "Annual Results Snapshot (Standalone) - Mar'26",
    "rhs": [
      {
        "prefix": "Net Sales ",
        "suffix": "YoY Growth in year ended Mar 2026 is 68.22% vs 472.99% in Mar 2025",
        "dir": -1
      },
      {
        "prefix": "Standalone Net Profit ",
        "suffix": "YoY Growth in year ended Mar 2026 is -92.62% vs 214.02% in Mar 2025",
        "dir": -1
      }
    ],
    "table": {
      "header": [
        "Mar'26",
        "Mar'25",
        "Change(%)"
      ],
      "body": [
        {
          "field": "Net Sales",
          "val1": "36.05",
          "val2": "21.43",
          "chgp": "68.22%",
          "chgp_class": "positive"
        },
        {
          "field": "Operating Profit (PBDIT) excl Other Income",
          "val1": "-0.21",
          "val2": "0.47",
          "chgp": "-144.68%",
          "chgp_class": "negative"
        },
        {
          "field": "Interest",
          "val1": "0.37",
          "val2": "0.07",
          "chgp": "428.57%",
          "chgp_class": "negative"
        },
        {
          "field": "Exceptional Items",
          "val1": "0.00",
          "val2": "0.00",
          "chgp": "",
          "chgp_class": "neutral"
        },
        {
          "field": "Standalone Net Profit",
          "val1": "0.09",
          "val2": "1.22",
          "chgp": "-92.62%",
          "chgp_class": "negative"
        },
        {
          "field": "Operating Profit Margin (Excl OI)",
          "val1": "-0.58%",
          "val2": "2.19%",
          "chgp": "-2.77%",
          "chgp_class": "negative"
        }
      ]
    }
  }
]

Quarterly Results Snapshot (Standalone) - Mar'26 - QoQstock-summary

Mar'26
Dec'25
Change(%)
Net Sales
8.24
8.72
-5.50%
Operating Profit (PBDIT) excl Other Income
-1.12
-0.92
-21.74%
Interest
0.11
0.09
22.22%
Exceptional Items
0.00
0.00
Standalone Net Profit
-1.13
-0.50
-126.00%
Operating Profit Margin (Excl OI)
-13.59%
-10.55%
-3.04%
Values in Rs Cr.
Direction Arrows
Net Sales

QoQ Growth in quarter ended Mar 2026 is -5.50% vs -8.98% in Dec 2025

Direction Arrows
Standalone Net Profit

QoQ Growth in quarter ended Mar 2026 is -126.00% vs -160.24% in Dec 2025

Half Yearly Results Snapshot (Standalone) - Sep'25stock-summary

Sep'25
Sep'24
Change(%)
Net Sales
19.09
6.67
186.21%
Operating Profit (PBDIT) excl Other Income
0.78
0.31
151.61%
Interest
0.16
0.09
77.78%
Exceptional Items
0.00
0.00
Standalone Net Profit
1.72
0.44
290.91%
Operating Profit Margin (Excl OI)
4.09%
4.65%
-0.56%
Values in Rs Cr.
Direction Arrows
Net Sales

Growth in half year ended Sep 2025 is 186.21% vs 560.40% in Sep 2024

Direction Arrows
Standalone Net Profit

Growth in half year ended Sep 2025 is 290.91% vs 2.33% in Sep 2024

Nine Monthly Results Snapshot (Standalone) - Dec'25stock-summary

Dec'25
Dec'24
Change(%)
Net Sales
27.81
10.42
166.89%
Operating Profit (PBDIT) excl Other Income
-0.14
0.24
-158.33%
Interest
0.25
0.10
150.00%
Exceptional Items
0.00
0.00
Standalone Net Profit
1.22
0.67
82.09%
Operating Profit Margin (Excl OI)
-0.50%
2.30%
-2.80%
Values in Rs Cr.
Direction Arrows
Net Sales

YoY Growth in nine months ended Dec 2025 is 166.89% vs 287.36% in Dec 2024

Direction Arrows
Standalone Net Profit

YoY Growth in nine months ended Dec 2025 is 82.09% vs 6,600.00% in Dec 2024

Annual Results Snapshot (Standalone) - Mar'26stock-summary

Mar'26
Mar'25
Change(%)
Net Sales
36.05
21.43
68.22%
Operating Profit (PBDIT) excl Other Income
-0.21
0.47
-144.68%
Interest
0.37
0.07
428.57%
Exceptional Items
0.00
0.00
Standalone Net Profit
0.09
1.22
-92.62%
Operating Profit Margin (Excl OI)
-0.58%
2.19%
-2.77%
Values in Rs Cr.
Direction Arrows
Net Sales

YoY Growth in year ended Mar 2026 is 68.22% vs 472.99% in Mar 2025

Direction Arrows
Standalone Net Profit

YoY Growth in year ended Mar 2026 is -92.62% vs 214.02% in Mar 2025

stock-summaryCompany CV
About Raunaq International Ltd stock-summary
stock-summary
Raunaq International Ltd
Micro Cap
Construction
Raunaq International Limited, formerly incorporated as 'Raunaq EPC International Limited' was established in 1965 by the esteemed promoter, Surinder P. Kanwar Group'. Further, the Company name was changed to "Raunaq International Limited" with effect from January 10, 2024. Company is engaged in Engineering Contracting Business and primarily in service of core infrastructural and industrial sectors in India, namely Power, Chemicals, Hydro-carbon, Metal and Automobile sectors.
Company Coordinates stock-summary
Company Details
20 K M Mathura Road, P O Amar Nagar Faridabad Haryana : 121003
stock-summary
Tel: 91-129-4288888
stock-summary
info@raunaqinti.com
Registrar Details
Link Intime India Pvt Ltd., Narang Tower 44, Community Centre, Naraina Industrial Area , Phase - 1, New Delhi