
Compare Raunaq Intl. with Similar Stocks
Dashboard
With a Operating Losses, the company has a Weak Long Term Fundamental Strength
- Poor long term growth as Operating profit has grown by an annual rate 10.79% of over the last 5 years
- Company's ability to service its debt is weak with a poor EBIT to Interest (avg) ratio of -3.10
Flat results in Mar 26
Risky - Negative EBITDA
Below par performance in long term as well as near term
Stock DNA
Construction
INR 9 Cr (Micro Cap)
NA (Loss Making)
32
0.00%
0.35
1.15%
1.18
Total Returns (Price + Dividend) 
Latest dividend: 1.2 per share ex-dividend date: Jul-26-2016
Risk Adjusted Returns v/s
Returns Beta

News
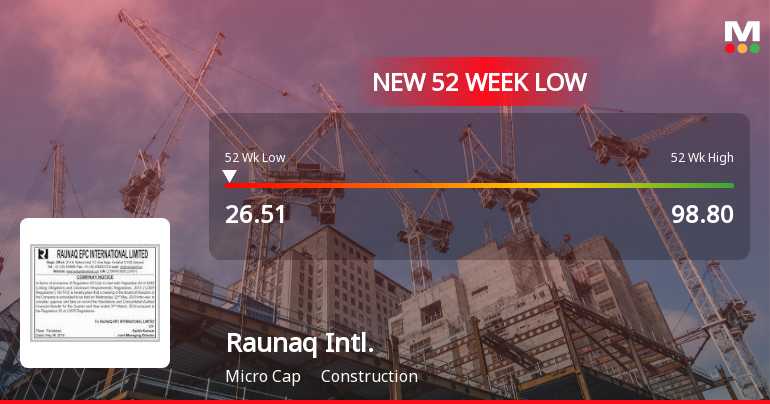
Raunaq International Ltd Falls to 52-Week Low of Rs 26.51 as Sell-Off Deepens
For the ninth consecutive session, Raunaq International Ltd has closed lower, culminating in a fresh 52-week low of Rs 26.51 on 10 Jun 2026. This marks a steep 40.71% decline over this losing streak, underscoring sustained selling pressure despite a broadly positive market backdrop.
Read full news article
Announcements
Compliances-Reg.24(A)-Annual Secretarial Compliance
30-May-2026 | Source : BSEPursuant to Regulation 24A of the SEBI (Listing Obligations and Disclosure Requirements) Regulation 2015 read with Master Circular No. HO/49/14/14(7)2015-CFD-POD2/I/3762/2026 dated January 30 2026 issued by Securities and Exchange Board of India (SEBI) please find enclosed herewith Annual Secretarial Compliance Report for the year ended March 31 2026 issued by M/s Surya Gupta & Associates Practicing Company Secretaries New Delhi. You are requested to the same on your records.
Announcement under Regulation 30 (LODR)-Newspaper Publication
28-May-2026 | Source : BSEPursuant to the Regulation 30 &47 of SEBI (Listing Obligations and Disclosure requirements) Regulations 2015 (the Regulations) please find enclosed herewith copy of the Audited Financial Results for the quarter/year ended March 31 2026 published by the Company in the newspapers i.e. Financial Express (English) and Jansatta (Hindi) on May 28 2026. You are requested to take the same on your records.
Board Meeting Intimation for Intimation Of The Board Meeting S.No: 2/26-27
11-May-2026 | Source : BSERaunaq International Ltdhas informed BSE that the meeting of the Board of Directors of the Company is scheduled on 27/05/2026 inter alia to consider and approve Audited Financial Results for the quarter and year ended March 31 2026. Pursuant to Regulation 29 of the SEBI (Listing Obligations and Disclosure Requirements) Regulations 2015 we hereby inform that 2/26-27 Meeting of the Board of Directors of the Company is scheduled to be held on May 27 2026 inter-alia; to consider approve and take on record the Audited Financial Results for the quarter and year ended March 31 2026. Further to our letter dated March 25 2026 this is to inform that in terms of the Code for Prevention of Insider Trading read with the SEBI (Prohibition of Insider Trading) Regulations 2015 the Trading Window for dealing in the shares of the Company for Promoters/Promoter Group/Directors/Key Managerial Personnel/Designated Persons/Connected Persons of the Company shall be closed till Friday May 29 2026. You are requested to take it on your records.
Corporate Actions

No Upcoming Board Meetings

Raunaq International Ltd has declared 12% dividend, ex-date: 26 Jul 16

No Splits history available

No Bonus history available

No Rights history available
Quality key factors
Valuation key factors
Technicals key factors
 Technical Indicator Scale: Bearish, Mildly Bearish, Sideways, Mildly Bullish, Bullish Turned
 Shareholding Snapshot : Mar 2026
Shareholding Compare (%holding)
Promoters
None
Held by 0 Schemes
Held by 0 FIIs
Mr. Surinder Paul Kanwar (43.87%)
Strategic Capital Partners Private Limited (7.34%)
31.95%
Quarterly Results Snapshot (Standalone) - Mar'26 - QoQ

QoQ Growth in quarter ended Mar 2026 is -5.50% vs -8.98% in Dec 2025
QoQ Growth in quarter ended Mar 2026 is -126.00% vs -160.24% in Dec 2025
Half Yearly Results Snapshot (Standalone) - Sep'25

Growth in half year ended Sep 2025 is 186.21% vs 560.40% in Sep 2024
Growth in half year ended Sep 2025 is 290.91% vs 2.33% in Sep 2024
Nine Monthly Results Snapshot (Standalone) - Dec'25
YoY Growth in nine months ended Dec 2025 is 166.89% vs 287.36% in Dec 2024
YoY Growth in nine months ended Dec 2025 is 82.09% vs 6,600.00% in Dec 2024
Annual Results Snapshot (Standalone) - Mar'26
YoY Growth in year ended Mar 2026 is 68.22% vs 472.99% in Mar 2025
YoY Growth in year ended Mar 2026 is -92.62% vs 214.02% in Mar 2025
About Raunaq International Ltd

Company Coordinates


