
Compare Ravinder Heights with Similar Stocks
Total Returns (Price + Dividend) 
Ravinder Heights for the last several years.
Risk Adjusted Returns v/s
Returns Beta

News

Ravinder Heights Ltd is Rated Sell
Ravinder Heights Ltd is rated Sell by MarketsMOJO, with this rating last updated on 04 February 2026. However, the analysis and financial metrics discussed here reflect the company’s current position as of 11 June 2026, providing investors with the latest insights into its performance and outlook.
Read full news article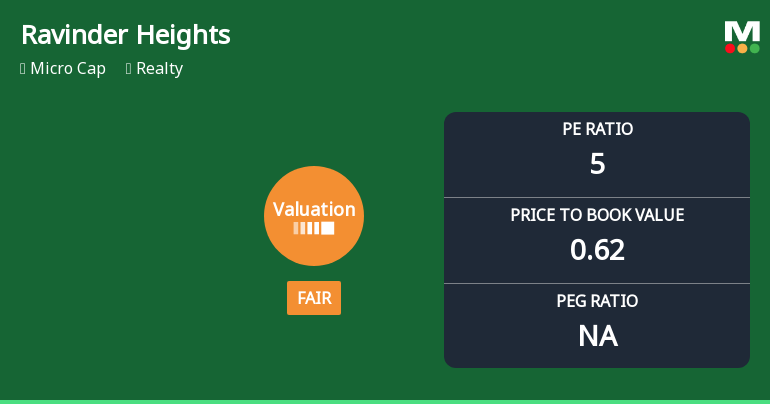
Ravinder Heights Ltd Valuation Shifts to Fair Amidst Market Pressure
Ravinder Heights Ltd, a micro-cap player in the realty sector, has witnessed a notable shift in its valuation parameters, moving from an expensive to a fair valuation grade. This change reflects evolving market perceptions amid a challenging price performance and a deteriorating mojo grade, signalling caution for investors amid broader sector dynamics.
Read full news articleAre Ravinder Heights Ltd latest results good or bad?
Ravinder Heights Ltd's latest financial results for Q4 FY26 present a challenging picture. The company reported net sales of just ₹0.01 crores, marking a significant decline of 99.95% from the previous quarter. This drastic drop in revenue has led to a net loss of ₹2.94 crores, a stark contrast to the profit of ₹12.48 crores recorded in Q3 FY26, representing a 123.56% decline. The PAT margin for the quarter was notably negative at -29,400%, indicating severe operational challenges. In contrast, the nine-month performance for FY26 shows a more favorable outcome, with consolidated profits of ₹49.41 crores on revenues of ₹75.16 crores, driven primarily by a strong Q2 FY26. This highlights the company's potential for profitability when projects are executed successfully, although the extreme volatility in quarterly results raises concerns about the sustainability of earnings. The company's return on equity (R...
Read full news article Announcements
Announcement under Regulation 30 (LODR)-Newspaper Publication
30-May-2026 | Source : BSEPublication of extract of Audited Finacial Results(Standalone & Consolidated) for the quarter and Financial Year ended 31st March 2026
Compliances-Reg.24(A)-Annual Secretarial Compliance
30-May-2026 | Source : BSEPlease find enclosed Annual Secretarial Compliance Report for the Financial Year ended March 31 2026
Board Meeting Outcome for Audited Financial Results(Standalone & Consolidated) For The Quarter And Financial Year Ended 31St March 2026
29-May-2026 | Source : BSEAudited Financial Results(Standalone & Consolidated) for the quarter & Financial Year Ended 31st March 2026
Corporate Actions

No Upcoming Board Meetings

No Dividend history available

No Splits history available

No Bonus history available

No Rights history available
Quality key factors
Valuation key factors
Technicals key factors
 Technical Indicator Scale: Bearish, Mildly Bearish, Sideways, Mildly Bullish, Bullish Turned
 Shareholding Snapshot : Mar 2026
Shareholding Compare (%holding)
Promoters
None
Held by 0 Schemes
Held by 0 FIIs
Sunanda Jain (74.74%)
Serum Institute Of India Pvt Ltd (4.34%)
16.62%
Quarterly Results Snapshot (Consolidated) - Mar'26 - QoQ

QoQ Growth in quarter ended Mar 2026 is -99.95% vs -63.62% in Dec 2025
QoQ Growth in quarter ended Mar 2026 is -123.56% vs -68.70% in Dec 2025
Half Yearly Results Snapshot (Consolidated) - Sep'25

Growth in half year ended Sep 2025 is 18,280.00% vs -6.25% in Sep 2024
Growth in half year ended Sep 2025 is 8,472.34% vs -135.00% in Sep 2024
Nine Monthly Results Snapshot (Consolidated) - Dec'25
YoY Growth in nine months ended Dec 2025 is 16,979.55% vs -6.38% in Dec 2024
YoY Growth in nine months ended Dec 2025 is 3,299.38% vs 11.96% in Dec 2024
Annual Results Snapshot (Consolidated) - Mar'26
YoY Growth in year ended Mar 2026 is 13,085.96% vs -8.06% in Mar 2025
YoY Growth in year ended Mar 2026 is 2,024.80% vs -18.14% in Mar 2025
About Ravinder Heights Ltd

Company Coordinates


