
 Price Point
Compare Ravindra Energy with Similar Stocks
ScoreDashboard
Weak Long Term Fundamental Strength with an average Return on Capital Employed (ROCE) of 5.43%
- Poor long term growth as Net Sales has grown by an annual rate of 5.02% over the last 5 years
- Low ability to service debt as the company has a high Debt to EBITDA ratio of 3.83 times
Negative results in Jun 26
With ROCE of 12.4, it has a Very Expensive valuation with a 4 Enterprise value to Capital Employed
Mojo ParametersStock DNA

Trading & Distributors

INR 2,920 Cr (Small Cap)

49.00
22

0.00%

0.97

19.09%

6.83
Total ReturnsTotal Returns (Price + Dividend) 
Latest dividend: 0.0100 per share ex-dividend date: Sep-06-2012
Risk Adjusted Returns v/s
Returns Beta
 News & Corporate Actions
News
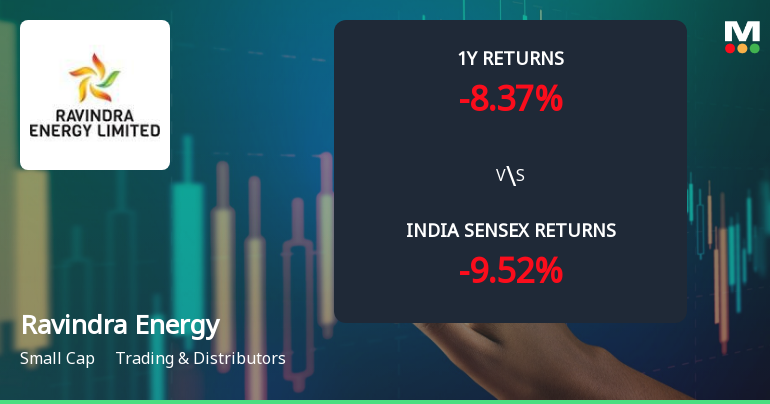
Ravindra Energy Ltd Faces Technical Momentum Shift Amid Bearish Signals
Ravindra Energy Ltd, a small-cap player in the Trading & Distributors sector, has experienced a notable shift in its technical momentum, with key indicators signalling a transition from mildly bullish to sideways or bearish trends. The stock’s recent 4.05% decline and downgrading to a Strong Sell rating by MarketsMOJO underscore growing investor caution amid mixed technical signals and underperformance relative to the broader market.
Read full news article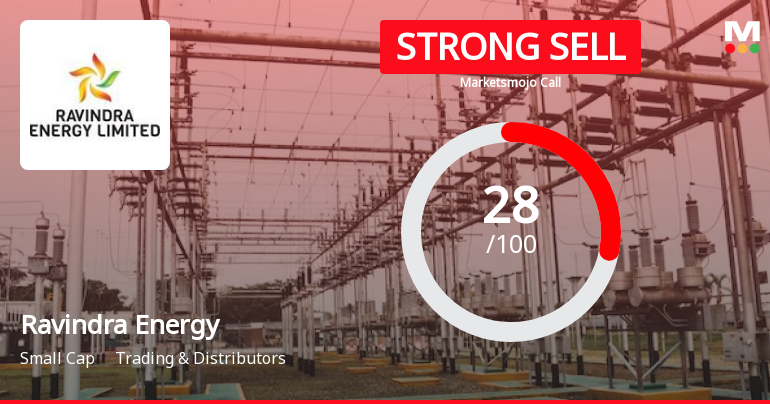
Ravindra Energy Ltd is Rated Strong Sell
Ravindra Energy Ltd is rated Strong Sell by MarketsMOJO, with this rating last updated on 18 August 2026. However, the analysis and financial metrics discussed here reflect the stock’s current position as of 10 September 2026, providing investors with the latest insights into the company’s fundamentals, valuation, financial trends, and technical outlook.
Read full news article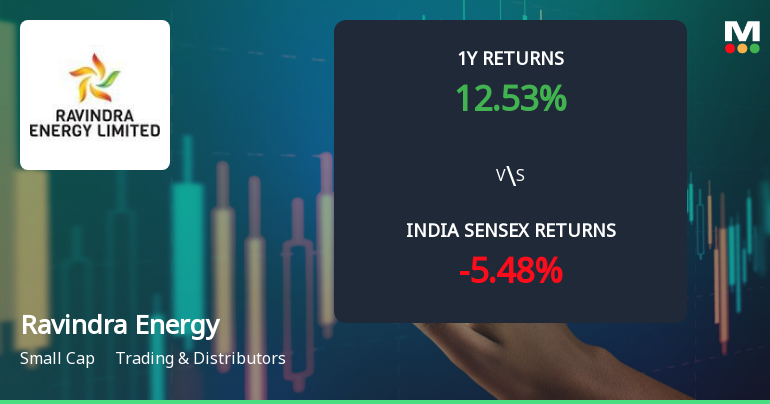
Ravindra Energy Ltd Sees Mildly Bullish Momentum Amid Mixed Technical Signals
Ravindra Energy Ltd, a small-cap player in the Trading & Distributors sector, has experienced a notable shift in its technical momentum, moving from a sideways trend to a mildly bullish stance. Despite a strong day change of 4.58% and a current price of ₹158.80, the stock’s technical indicators present a nuanced picture, with mixed signals from MACD, RSI, moving averages, and other momentum oscillators. This article analyses these developments in detail, placing them in the context of the company’s recent performance and broader market trends.
Read full news article Announcements
Announcement under Regulation 30 (LODR)-Newspaper Publication
11-Sep-2026 | Source : BSEPlease find enclosed the copies of newspaper publication on the 46th Annual General Meeting of the Company and the E-Voting Information
Reg. 34 (1) Annual Report.
06-Sep-2026 | Source : BSEPlease find enclosed the Annual Report for the Financial Year 2025-26.
Announcement under Regulation 30 (LODR)-Newspaper Publication
06-Sep-2026 | Source : BSEPlease find enclosed the copies of newspaper publication with regard to the 46th Annual General Meeting of the Company
Corporate Actions

No Upcoming Board Meetings

Ravindra Energy Ltd has declared 10% dividend, ex-date: 06 Sep 12

No Splits history available

No Bonus history available

Ravindra Energy Ltd has announced 1:9 rights issue, ex-date: 08 Jun 26
Key FactorsQuality key factors
Valuation key factors
Technicals key factors
 Technical Indicator Scale: Bearish, Mildly Bearish, Sideways, Mildly Bullish, Bullish Turned Shareholding
Shareholding Snapshot : Jun 2026
Shareholding Compare (%holding)
Promoters
20.4109
Held by 2 Schemes (2.97%)
Held by 13 FIIs (3.27%)
Khandepar Investments Private Limited (30.49%)
Quant Mutual Fund A/c Quant Infrastructure Fund (2.97%)
22.37%
FinancialQuarterly Results Snapshot (Consolidated) - Jun'26 - QoQ
 Compare with Peers
QoQ Growth in quarter ended Jun 2026 is -9.84% vs 4.63% in Mar 2026
QoQ Growth in quarter ended Jun 2026 is -87.00% vs -13.80% in Mar 2026

Half Yearly Results Snapshot (Consolidated) - Sep'25

Growth in half year ended Sep 2025 is 639.04% vs -54.61% in Sep 2024
Growth in half year ended Sep 2025 is 694.96% vs -44.21% in Sep 2024
Nine Monthly Results Snapshot (Consolidated) - Dec'25
YoY Growth in nine months ended Dec 2025 is 348.59% vs -9.34% in Dec 2024
YoY Growth in nine months ended Dec 2025 is 664.80% vs -28.70% in Dec 2024
Annual Results Snapshot (Consolidated) - Mar'26
YoY Growth in year ended Mar 2026 is 116.92% vs 91.20% in Mar 2025
YoY Growth in year ended Mar 2026 is 270.61% vs 142.85% in Mar 2025
 Company CV
About Ravindra Energy Ltd

Company Coordinates










