
 Price Point
Compare RDB Infrastruc. with Similar Stocks
ScoreDashboard
Weak Long Term Fundamental Strength with an average Return on Capital Employed (ROCE) of 3.16%
- Poor long term growth as Net Sales has grown by an annual rate of 13.55% and Operating profit at 3.96% over the last 5 years
- Low ability to service debt as the company has a high Debt to EBITDA ratio of 5.84 times
Flat results in Jun 26
With ROCE of 5.2, it has a Expensive valuation with a 1.2 Enterprise value to Capital Employed
Underperformed the market in the last 1 year


 Total Returns
Total Returns (Price + Dividend) 
Latest dividend: 0.0980544747081712 per share ex-dividend date: Aug-27-2015
Risk Adjusted Returns v/s
Returns Beta
 News & Corporate Actions
News
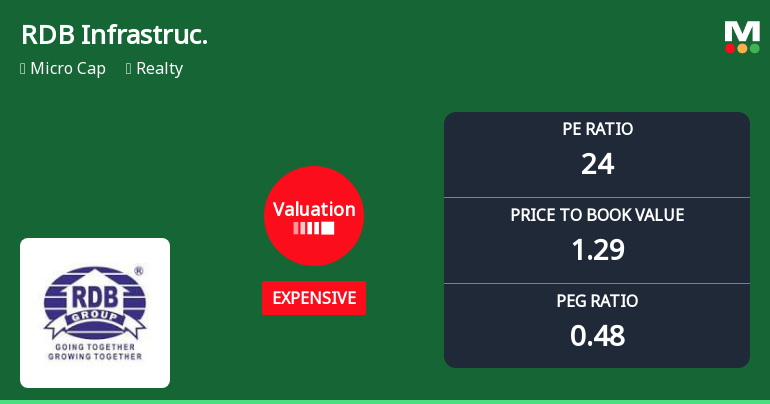
RDB Infrastructure and Power Ltd: Valuation Shifts Signal Price Attractiveness Change Amid Market Pressure
RDB Infrastructure and Power Ltd has witnessed a notable shift in its valuation parameters, moving from a very expensive to an expensive rating, reflecting evolving market perceptions and financial performance within the realty sector. Despite a challenging year-to-date return of -75.6%, the company’s valuation metrics and peer comparisons offer a nuanced view of its price attractiveness and investment appeal.
Read full news article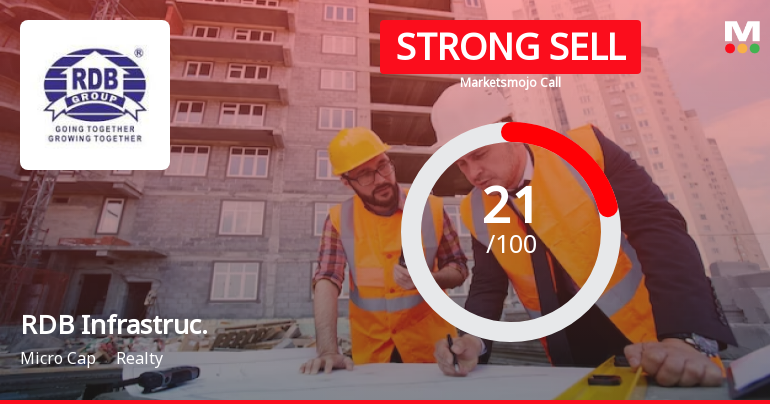
RDB Infrastructure and Power Ltd is Rated Strong Sell
RDB Infrastructure and Power Ltd is rated Strong Sell by MarketsMOJO. This rating was last updated on 24 February 2026, reflecting a significant reassessment of the stock’s outlook. However, the analysis and financial metrics presented here are based on the company’s current position as of 23 September 2026, providing investors with the latest insights into its fundamentals, valuation, financial trends, and technical standing.
Read full news article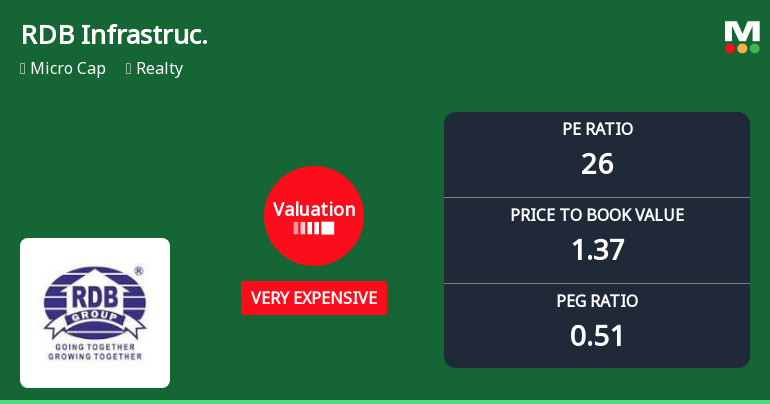
RDB Infrastructure and Power Ltd Valuation Shifts Signal Heightened Price Risk
RDB Infrastructure and Power Ltd, a micro-cap player in the Realty sector, has witnessed a marked shift in its valuation parameters, moving from an already expensive rating to a very expensive classification. This change comes amid significant price fluctuations and a challenging market environment, prompting a reassessment of its price attractiveness relative to historical and peer benchmarks.
Read full news article Announcements
Closure of Trading Window
28-Sep-2026 | Source : BSEIntimation for closure of trading window.
Shareholder Meeting / Postal Ballot-Scrutinizers Report
27-Sep-2026 | Source : BSEScrutinzer report along with E-voting results for the 20th AGM of the Company.
Shareholder Meeting / Postal Ballot-Outcome of AGM
26-Sep-2026 | Source : BSEProceedings of the 20th AGM of the Company helf on Saturday 26 September 2026 at 11:30 Am through VC/OCVM.
Corporate Actions

No Upcoming Board Meetings

RDB Infrastructure and Power Ltd has declared 10% dividend, ex-date: 27 Aug 15

RDB Infrastructure and Power Ltd has announced 1:10 stock split, ex-date: 28 Feb 25

No Bonus history available

No Rights history available
Key FactorsQuality key factors
Valuation key factors
Technicals key factors
 Technical Indicator Scale: Bearish, Mildly Bearish, Sideways, Mildly Bullish, Bullish Turned Shareholding
Shareholding Snapshot : Jun 2026
Shareholding Compare (%holding)
Promoters
None
Held by 0 Schemes
Held by 3 FIIs (2.06%)
Bfm Industries Limited (14.52%)
Manisha Pincha (2.51%)
20.96%
FinancialQuarterly Results Snapshot (Standalone) - Jun'26 - YoY
 Compare with Peers
YoY Growth in quarter ended Jun 2026 is -57.95% vs 120.07% in Jun 2025
YoY Growth in quarter ended Jun 2026 is 63.24% vs 186.32% in Jun 2025

Half Yearly Results Snapshot (Consolidated) - Sep'25
Not Applicable: The company has declared_date for only one period
Not Applicable: The company has declared_date for only one period
Nine Monthly Results Snapshot (Consolidated) - Dec'25

YoY Growth in nine months ended Dec 2025 is 114.00% vs -19.35% in Dec 2023
YoY Growth in nine months ended Dec 2025 is -6.55% vs -2.14% in Dec 2023
Annual Results Snapshot (Consolidated) - Mar'26
YoY Growth in year ended Mar 2026 is 15.78% vs -14.21% in Mar 2024
YoY Growth in year ended Mar 2026 is -36.65% vs 24.65% in Mar 2024
 Company CV
About RDB Infrastructure and Power Ltd










