
Compare Real Eco-Energy with Similar Stocks
Dashboard
With a Operating Losses, the company has a Weak Long Term Fundamental Strength
- Company's ability to service its debt is weak with a poor EBIT to Interest (avg) ratio of -1.82
- The company has been able to generate a Return on Equity (avg) of 6.76% signifying low profitability per unit of shareholders funds
Flat results in Mar 26
With ROE of 29.1, it has a Very Expensive valuation with a 6.4 Price to Book Value
Consistent Underperformance against the benchmark over the last 3 years
Total Returns (Price + Dividend) 
Real Eco-Energy for the last several years.
Risk Adjusted Returns v/s
Returns Beta

News

Real Eco-Energy Ltd is Rated Strong Sell
Real Eco-Energy Ltd is rated Strong Sell by MarketsMOJO, with this rating last updated on 29 May 2025. However, the analysis and financial metrics presented here reflect the stock's current position as of 08 June 2026, providing investors with an up-to-date view of the company’s performance and outlook.
Read full news article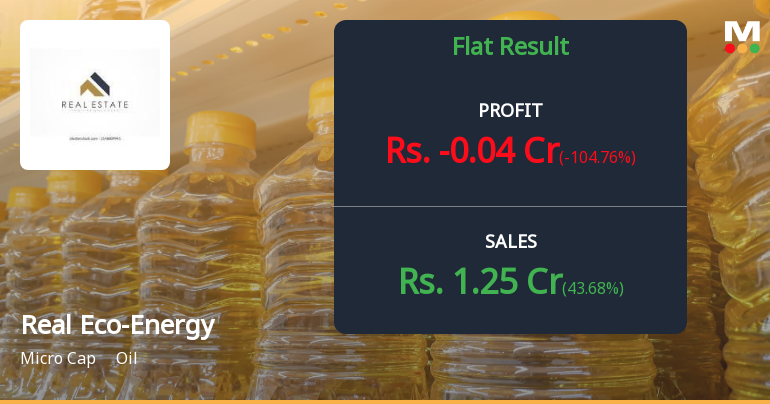
Real Eco-Energy Q4 FY26: Sharp Loss Reversal Amid Erratic Revenue Pattern Raises Sustainability Concerns
Real Eco-Energy Ltd., a micro-cap oil sector company with a market capitalisation of ₹46.00 crores, reported a concerning reversal to losses in Q4 FY26, posting a net loss of ₹0.04 crores compared to a profit of ₹0.81 crores in the year-ago quarter. The company's highly erratic revenue pattern and deteriorating profitability metrics underscore fundamental sustainability concerns that have plagued this troubled enterprise for years.
Read full news article Announcements
Announcement under Regulation 30 (LODR)-Newspaper Publication
04-Jun-2026 | Source : BSEPlease find enclosed herewith the copy of advertisement published for the Audited Financial Results for the quarter & year ended on March 31 2026
Financial Results For The Quarter & Year Ended On March 31 2026
29-May-2026 | Source : BSEFinancial Results for the quarter & year ended on March 31 2026
Board Meeting Outcome for Financial Results For The Quarter & Year Ended March 31 2026
29-May-2026 | Source : BSEConsidered and approved the Standalone Audited Financial Results of the Company for the Quarter and Year ended March 31 2026
Corporate Actions

No Upcoming Board Meetings

No Dividend history available

Real Eco-Energy Ltd has announced 2:10 stock split, ex-date: 04 Oct 24

No Bonus history available

No Rights history available
Quality key factors
Valuation key factors
Technicals key factors
 Technical Indicator Scale: Bearish, Mildly Bearish, Sideways, Mildly Bullish, Bullish Turned
 Shareholding Snapshot : Mar 2026
Shareholding Compare (%holding)
Non Institution
None
Held by 0 Schemes
Held by 0 FIIs
Patel Dharm Swetank (25.25%)
Goodness Consultancy Llp (16.07%)
35.79%
Quarterly Results Snapshot (Standalone) - Mar'26 - QoQ

QoQ Growth in quarter ended Mar 2026 is 43.68% vs 135.14% in Dec 2025
QoQ Growth in quarter ended Mar 2026 is -104.76% vs 133.33% in Dec 2025
Half Yearly Results Snapshot (Standalone) - Sep'25

Growth in half year ended Sep 2025 is 0.00% vs -100.00% in Sep 2024
Growth in half year ended Sep 2025 is -471.43% vs -16.67% in Sep 2024
Nine Monthly Results Snapshot (Standalone) - Dec'25
YoY Growth in nine months ended Dec 2025 is 0.00% vs -100.00% in Dec 2024
YoY Growth in nine months ended Dec 2025 is 540.00% vs -42.86% in Dec 2024
Annual Results Snapshot (Standalone) - Mar'26
YoY Growth in year ended Mar 2026 is -25.67% vs 980.65% in Mar 2025
YoY Growth in year ended Mar 2026 is -44.44% vs 278.95% in Mar 2025
About Real Eco-Energy Ltd

Company Coordinates


