
Compare Redtape with Similar Stocks
Dashboard
High Management Efficiency with a high ROCE of 18.85%
Poor long term growth as Operating profit has grown by an annual rate 16.97% of over the last 5 years
Positive results in Mar 26
With ROCE of 18.5, it has a Expensive valuation with a 4.7 Enterprise value to Capital Employed
Majority shareholders : Promoters
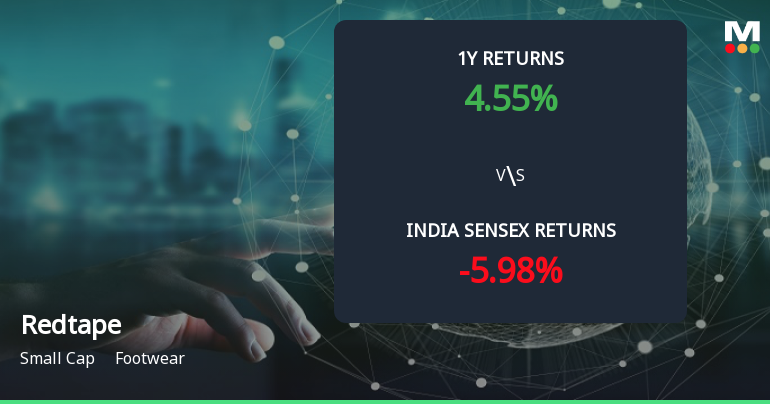
Total Returns (Price + Dividend) 
Latest dividend: 0.24 per share ex-dividend date: Aug-01-2025
Risk Adjusted Returns v/s
Returns Beta

News
Golden Cross Confirmed: Do Redtape Ltd's Other Technical Indicators Agree?
The 50-day moving average has crossed above the 200-day moving average for Redtape Ltd, signalling a golden cross on 15 Jun 2026. Yet, the broader technical and fundamental picture presents a nuanced view that tempers the enthusiasm this crossover might typically inspire.
Read full news article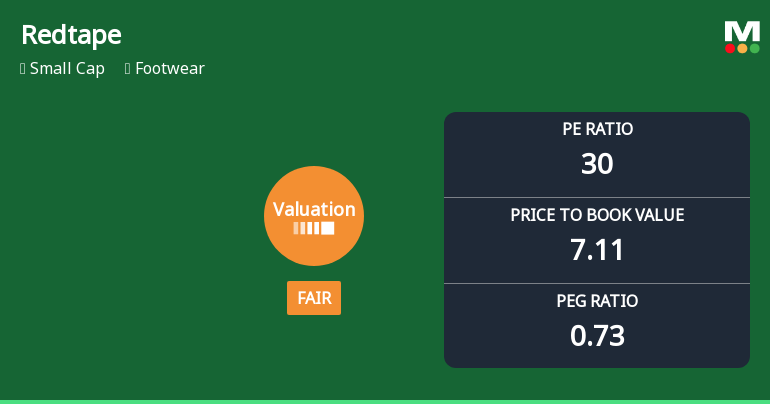
Redtape Ltd Valuation Shifts to Fair; P/E and P/BV Metrics Signal Improved Price Attractiveness
Redtape Ltd, a small-cap player in the footwear sector, has seen a notable shift in its valuation parameters, moving from an expensive to a fair valuation grade. This change is underpinned by its current price-to-earnings (P/E) ratio of 30.21 and price-to-book value (P/BV) of 7.11, which now position the stock as more attractively priced relative to its historical levels and peer group. Despite a recent day decline of 1.93%, the company’s fundamentals and valuation metrics suggest a recalibrated market perception that investors should carefully analyse.
Read full news article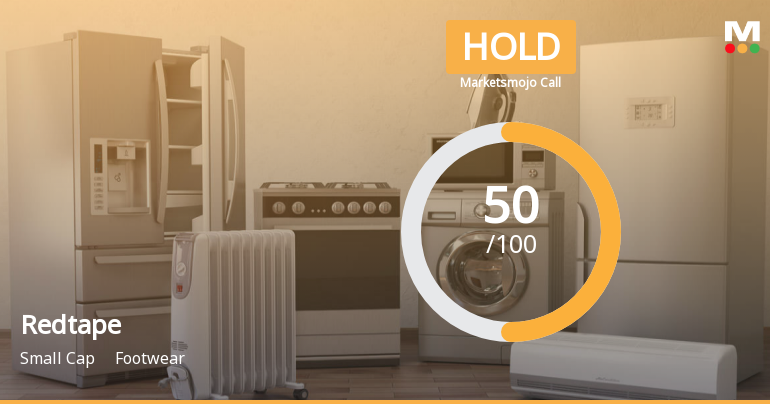
Redtape Ltd is Rated Hold by MarketsMOJO
Redtape Ltd is rated 'Hold' by MarketsMOJO, with this rating last updated on 01 April 2026. However, the analysis and financial metrics discussed here reflect the company’s current position as of 08 June 2026, providing investors with an up-to-date view of the stock’s fundamentals, returns, and market standing.
Read full news article Announcements
Announcement under Regulation 30 (LODR)-Earnings Call Transcript
02-Jun-2026 | Source : BSETranscript of Investor Meet for the 4th Quarter and year ended March 31 2026
Announcement under Regulation 30 (LODR)-Newspaper Publication
27-May-2026 | Source : BSENewspaper publication under Regulation 30 & 47 of SEBI (Listing Obligation and Disclosure Requirements) regulations 2015
Announcement under Regulation 30 (LODR)-Investor Presentation
26-May-2026 | Source : BSEInvestor Presentation
Corporate Actions

No Upcoming Board Meetings

Redtape Ltd has declared 100% dividend, ex-date: 31 Jul 26

No Splits history available

Redtape Ltd has announced 3:1 bonus issue, ex-date: 04 Feb 25

No Rights history available
Quality key factors
Valuation key factors
Technicals key factors
 Technical Indicator Scale: Bearish, Mildly Bearish, Sideways, Mildly Bullish, Bullish Turned
 Shareholding Snapshot : Mar 2026
Shareholding Compare (%holding)
Promoters
None
Held by 10 Schemes (11.0%)
Held by 68 FIIs (3.81%)
Rashid Ahmed Mirza (35.81%)
Icici Prudential India Opportunities Fund (6.69%)
9.82%
Quarterly Results Snapshot (Consolidated) - Mar'26 - QoQ

QoQ Growth in quarter ended Mar 2026 is -14.12% vs 59.74% in Dec 2025
QoQ Growth in quarter ended Mar 2026 is -33.15% vs 279.56% in Dec 2025
Half Yearly Results Snapshot (Consolidated) - Sep'25
Growth in half year ended Sep 2025 is 11.54% vs 19.37% in Sep 2024

Growth in half year ended Sep 2025 is 18.72% vs -25.19% in Sep 2024
Nine Monthly Results Snapshot (Consolidated) - Dec'25
YoY Growth in nine months ended Dec 2025 is 14.78% vs 13.67% in Dec 2024
YoY Growth in nine months ended Dec 2025 is 32.53% vs -4.81% in Dec 2024
Annual Results Snapshot (Consolidated) - Mar'26
YoY Growth in year ended Mar 2026 is 19.69% vs 9.32% in Mar 2025
YoY Growth in year ended Mar 2026 is 41.50% vs -3.54% in Mar 2025
About Redtape Ltd

Company Coordinates


