
Compare Regis Industries with Similar Stocks
Stock DNA
Non Banking Financial Company (NBFC)
INR 58 Cr (Micro Cap)
77.00
NA
0.00%
0.00
2.74%
2.11
Total Returns (Price + Dividend) 
Regis Industries for the last several years.
Risk Adjusted Returns v/s
Returns Beta

News

Regis Industries Ltd is Rated Strong Sell
Regis Industries Ltd is rated Strong Sell by MarketsMOJO, with this rating last updated on 06 May 2026. However, the analysis and financial metrics discussed below reflect the stock's current position as of 29 May 2026, providing investors with the latest insights into the company’s performance and outlook.
Read full news article
Regis Industries Ltd is Rated Strong Sell
Regis Industries Ltd is rated Strong Sell by MarketsMOJO, with this rating last updated on 06 May 2026. However, the analysis and financial metrics discussed here reflect the stock’s current position as of 18 May 2026, providing investors with an up-to-date view of the company’s performance and outlook.
Read full news article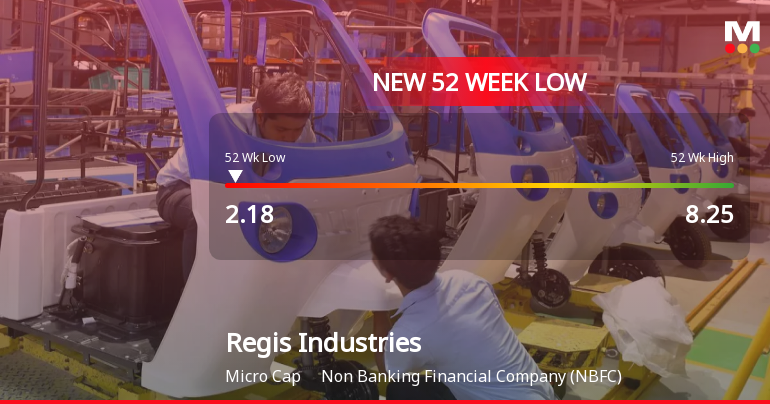
Regis Industries Ltd Falls to 52-Week Low of Rs 2.18 as Sell-Off Deepens
For the second consecutive session, Regis Industries Ltd has succumbed to selling pressure, hitting a fresh 52-week low of Rs 2.18 on 11 Jun 2026, marking a steep decline of 64.28% over the past year against a modest 3.92% fall in the Sensex.
Read full news article Announcements
Compliances-Reg.24(A)-Annual Secretarial Compliance
21-May-2026 | Source : BSEPFA
Board Meeting Outcome for Audited Financial Results Of The Company For The Quarter And Year Ended On 31St March 2026 And Outcome Of The Board Meeting Held On Thursday 7Th May 2026.
07-May-2026 | Source : BSEThis is to inform you that Outcome of the Board Meeting of the Company held on today i.e. Thursday 7th May 2026 in accordance with SEBl (Listing Obligations and Disclosures Requirements) Regulations 2015 has been approved by the Board of Directors of the Company and taken on record inter-alia the following items; 1.) Consideration and Approval of Audited Financial Result for the Year ended 31st March 2026. 2.) Independent Auditors Report in pursuance with Regulation 33 of SEBI (LODR) Regulations 2015 for the F.Y. 31st March 2026. Further we hereby declare that the Auditor of the Company has issued the Audit report under the Companies Act 2013 and financial results as prepared under SEBI (Listing obligations and Disclosure Requirements) Regulations 2015 for the financial year ended on March 31 2026 with Unmodified Opinion. The board meeting commenced at 05.50 PM and concluded at 06:20 PM. We request you to kindly take on record the same. Thanking You.
Disclosure Under Regulation 32(1) Of SEBI (Listing Obligation And Disclosure Requirements) Regulations 2015
07-May-2026 | Source : BSEPFA
Corporate Actions

No Upcoming Board Meetings

No Dividend history available

Regis Industries Ltd has announced 1:10 stock split, ex-date: 16 Jan 25

Regis Industries Ltd has announced 1:2 bonus issue, ex-date: 12 Sep 25

No Rights history available
Quality key factors
Valuation key factors
Technicals key factors
 Technical Indicator Scale: Bearish, Mildly Bearish, Sideways, Mildly Bullish, Bullish Turned
 Shareholding Snapshot : Mar 2026
Shareholding Compare (%holding)
Non Institution
None
Held by 0 Schemes
Held by 0 FIIs
None
Strategic Shares Solutions Pvt Limited (10.14%)
11.76%
Quarterly Results Snapshot (Standalone) - Mar'26 - QoQ

QoQ Growth in quarter ended Mar 2026 is 198.48% vs 20.00% in Dec 2025

QoQ Growth in quarter ended Mar 2026 is -2,225.00% vs 0.00% in Dec 2025
Half Yearly Results Snapshot (Standalone) - Sep'25
Growth in half year ended Sep 2025 is -67.75% vs 69.43% in Sep 2024
Growth in half year ended Sep 2025 is 660.71% vs 69.57% in Sep 2024
Nine Monthly Results Snapshot (Standalone) - Dec'25
YoY Growth in nine months ended Dec 2025 is -73.78% vs 96.79% in Dec 2024
YoY Growth in nine months ended Dec 2025 is 296.34% vs 33.33% in Dec 2024
Annual Results Snapshot (Standalone) - Mar'26
YoY Growth in year ended Mar 2026 is -62.95% vs 4.67% in Mar 2025
YoY Growth in year ended Mar 2026 is 330.30% vs 64.52% in Mar 2025
About Regis Industries Ltd

Company Coordinates


