
Compare Rel. Chemotex with Similar Stocks
Dashboard
Weak Long Term Fundamental Strength with an average Return on Capital Employed (ROCE) of 9.25%
- Poor long term growth as Net Sales has grown by an annual rate of 7.21% and Operating profit at 10.80% over the last 5 years
- Low ability to service debt as the company has a high Debt to EBITDA ratio of 8.15 times
Negative results in Mar 26
Consistent Underperformance against the benchmark over the last 3 years
Stock DNA
Garments & Apparels
INR 91 Cr (Micro Cap)
17.00
23
0.44%
1.83
3.83%
0.66
Total Returns (Price + Dividend) 
Latest dividend: 0.5 per share ex-dividend date: Sep-19-2025
Risk Adjusted Returns v/s
Returns Beta

News
Are Reliance Chemotex Industries Ltd latest results good or bad?
Reliance Chemotex Industries Ltd's latest financial results for Q4 FY26 present a mixed picture. The company reported a net sales figure of ₹88.18 crores, reflecting a sequential growth of 7.62% from the previous quarter. This growth is notable, especially when compared to the prior quarter's decline. However, despite this revenue growth, the company's operating profit margins, excluding other income, contracted to 10.18%, marking the lowest level in seven quarters. This indicates significant operational challenges, as the company struggles to maintain profitability amidst rising costs and market pressures. The net profit for the quarter was ₹1.75 crores, which represents a substantial increase of 118.75% quarter-on-quarter. However, this figure is down 4.89% year-on-year, raising concerns about the sustainability of such earnings growth. A critical aspect of the results is the unusual spike in other incom...
Read full news article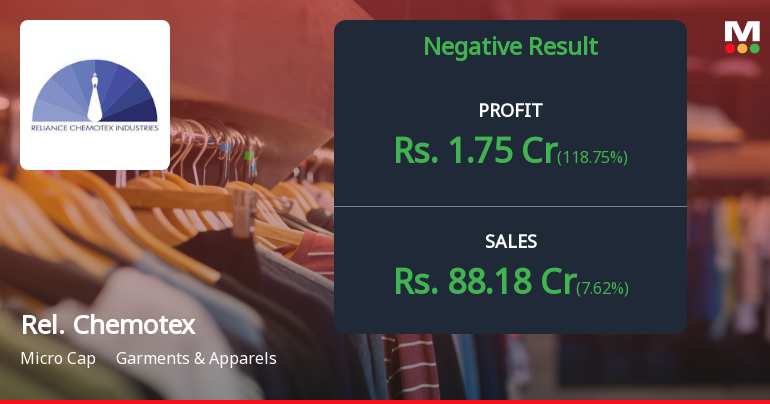
Reliance Chemotex Q4 FY26: Profitability Pressures Mount Despite Revenue Gains
Reliance Chemotex Industries Ltd., a Rajasthan-based synthetic and blended yarn manufacturer, reported a net profit of ₹1.75 crores for the quarter ended March 2026, marking a 118.75% surge quarter-on-quarter but a marginal 4.89% decline year-on-year. The micro-cap company, with a market capitalisation of ₹92.00 crores, continues to trade at ₹120.65, down 33.34% over the past year and significantly below its 52-week high of ₹211.65.
Read full news article
Reliance Chemotex Industries Ltd is Rated Sell
Reliance Chemotex Industries Ltd is rated 'Sell' by MarketsMOJO, with this rating last updated on 04 May 2026. However, the analysis and financial metrics discussed here reflect the stock's current position as of 27 May 2026, providing investors with the latest insights into its performance and outlook.
Read full news article Announcements
Corporate Actions

No Upcoming Board Meetings

Reliance Chemotex Industries Ltd has declared 5% dividend, ex-date: 19 Sep 25

No Splits history available

No Bonus history available

Reliance Chemotex Industries Ltd has announced 1:1 rights issue, ex-date: 19 Jun 19
Quality key factors
Valuation key factors
Technicals key factors
 Technical Indicator Scale: Bearish, Mildly Bearish, Sideways, Mildly Bullish, Bullish Turned
 Shareholding Snapshot : Mar 2026
Shareholding Compare (%holding)
Promoters
None
Held by 0 Schemes
Held by 0 FIIs
Modern Fibotex India Limited (41.36%)
Hemant Pratapbhai Kotak (1.09%)
24.16%
Quarterly Results Snapshot (Standalone) - Mar'26 - QoQ

QoQ Growth in quarter ended Mar 2026 is 7.62% vs -17.66% in Dec 2025
QoQ Growth in quarter ended Mar 2026 is 118.75% vs -51.52% in Dec 2025
Half Yearly Results Snapshot (Standalone) - Sep'25
Growth in half year ended Sep 2025 is 4.19% vs 2.65% in Sep 2024
Growth in half year ended Sep 2025 is 35.32% vs -25.28% in Sep 2024
Nine Monthly Results Snapshot (Standalone) - Dec'25

YoY Growth in nine months ended Dec 2025 is -0.93% vs 4.33% in Dec 2024
YoY Growth in nine months ended Dec 2025 is 60.00% vs -20.00% in Dec 2024
Annual Results Snapshot (Standalone) - Mar'26
YoY Growth in year ended Mar 2026 is 0.95% vs -2.34% in Mar 2025
YoY Growth in year ended Mar 2026 is 29.88% vs 26.17% in Mar 2025
About Reliance Chemotex Industries Ltd

Company Coordinates


