
Compare Relaxo Footwear with Similar Stocks
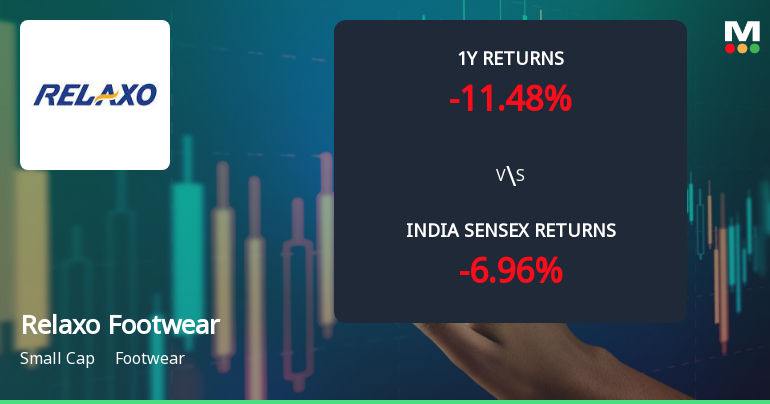
Total Returns (Price + Dividend) 
Latest dividend: 3 per share ex-dividend date: Aug-21-2025
Risk Adjusted Returns v/s
Returns Beta

News
Relaxo Footwears Ltd Technical Momentum Shifts Amid Mixed Market Signals
Relaxo Footwears Ltd has exhibited a shift in price momentum, moving from a sideways trend to a mildly bullish stance as per recent technical indicators. Despite a modest daily gain of 2.68%, the stock’s technical parameters present a nuanced picture, with some indicators signalling strength while others suggest caution. This analysis delves into the latest technical trends, momentum oscillators, and moving averages to provide a comprehensive view of Relaxo’s current market positioning.
Read full news article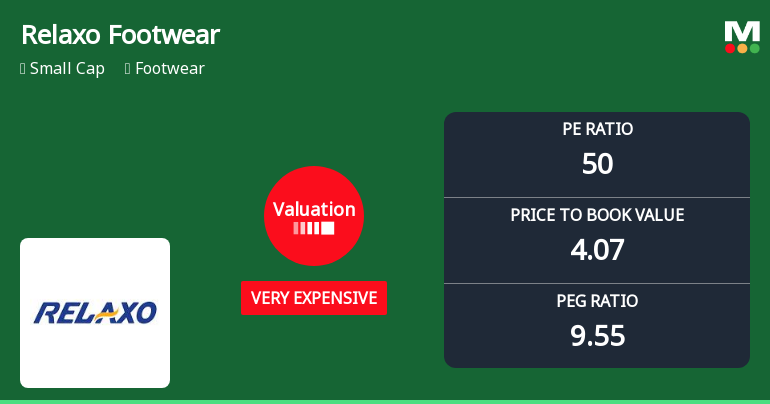
Relaxo Footwears Ltd Valuation Shifts Signal Elevated Price Risk Amid Sector Dynamics
Relaxo Footwears Ltd has seen a notable shift in its valuation parameters, moving from an expensive to a very expensive rating, despite mixed performance metrics and a challenging return profile compared to the broader market. This article analyses the recent valuation changes, peer comparisons, and what this means for investors navigating the footwear sector.
Read full news article
Relaxo Footwears Ltd Downgraded to Sell on Weak Technicals and Valuation Concerns
Relaxo Footwears Ltd has seen its investment rating downgraded from Hold to Sell, driven primarily by deteriorating technical indicators and a shift in valuation metrics. Despite some short-term price gains, the company’s long-term financial trends and quality scores have raised concerns among analysts, prompting a reassessment of its market position within the footwear sector.
Read full news article Announcements
Announcement under Regulation 30 (LODR)-Updates on Acquisition
16-Jun-2026 | Source : BSEIncorporation of Special Purpose Vehicle - Clean Max MUOI Private Limited
Report On Lodgment/Re-Lodgment Of Transfer Requests And Dematerialization Of Physical Shares
11-Jun-2026 | Source : BSEReport on Lodgment /re-lodgment of Transfer requests and Dematerialization of Physical Shares
Announcement under Regulation 30 (LODR)-Earnings Call Transcript
03-Jun-2026 | Source : BSEInvestor Call Transcript for the investor meet held on May 29 2026
Corporate Actions

No Upcoming Board Meetings

Relaxo Footwears Ltd has declared 300% dividend, ex-date: 21 Aug 25

Relaxo Footwears Ltd has announced 1:5 stock split, ex-date: 22 Nov 13

Relaxo Footwears Ltd has announced 1:1 bonus issue, ex-date: 26 Jun 19

No Rights history available
Quality key factors
Valuation key factors
Technicals key factors
 Technical Indicator Scale: Bearish, Mildly Bearish, Sideways, Mildly Bullish, Bullish Turned
 Shareholding Snapshot : Mar 2026
Shareholding Compare (%holding)
Promoters
None
Held by 10 Schemes (9.62%)
Held by 102 FIIs (3.04%)
Ramesh Kumar Dua (23.43%)
Sbi Large & Midcap Fund (9.43%)
6.37%
Quarterly Results Snapshot (Standalone) - Mar'26 - YoY

YoY Growth in quarter ended Mar 2026 is 8.05% vs -6.97% in Mar 2025
YoY Growth in quarter ended Mar 2026 is 20.37% vs -8.42% in Mar 2025
Half Yearly Results Snapshot (Standalone) - Sep'25

Growth in half year ended Sep 2025 is -10.12% vs -1.83% in Sep 2024
Growth in half year ended Sep 2025 is 4.88% vs -19.31% in Sep 2024
Nine Monthly Results Snapshot (Standalone) - Dec'25
YoY Growth in nine months ended Dec 2025 is -6.85% vs -3.34% in Dec 2024
YoY Growth in nine months ended Dec 2025 is -2.20% vs -17.95% in Dec 2024
Annual Results Snapshot (Standalone) - Mar'26
YoY Growth in year ended Mar 2026 is -3.13% vs -4.27% in Mar 2025
YoY Growth in year ended Mar 2026 is 5.25% vs -15.03% in Mar 2025
About Relaxo Footwears Ltd

Company Coordinates


