
Compare Reliance Communi with Similar Stocks
Dashboard
With a Negative Book Value, the company has a Weak Long Term Fundamental Strength
- Poor long term growth as Net Sales has grown by an annual rate of -16.20% and Operating profit at 0% over the last 5 years
- The company has a negative book value of Rs 102,565.00 crore
The company has declared Negative results for the last 3 consecutive quarters
Risky - Negative EBITDA
Stock DNA
Telecom - Services
INR 254 Cr (Micro Cap)
NA (Loss Making)
37
0.00%
-0.46
0.31%
0.00
Total Returns (Price + Dividend) 
Latest dividend: 0.25 per share ex-dividend date: Aug-14-2013
Risk Adjusted Returns v/s
Returns Beta

News

Reliance Communications Ltd is Rated Strong Sell
Reliance Communications Ltd is rated Strong Sell by MarketsMOJO, with this rating last updated on 13 Jan 2025. However, the analysis and financial metrics discussed here reflect the stock’s current position as of 11 June 2026, providing investors with an up-to-date view of the company’s fundamentals, valuation, financial trends, and technical outlook.
Read full news article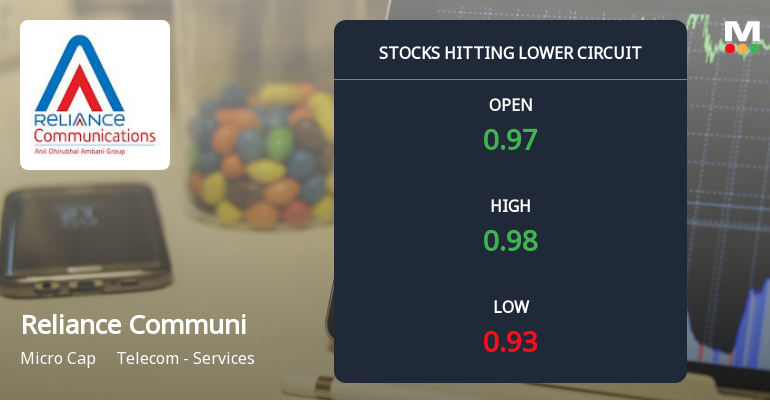
Reliance Communications Ltd Locks at Lower Circuit With 2.06% Loss — Sellers Queue, No Buyers in Sight
At Rs 0.93, sellers were still queuing — but there were no buyers willing to take the other side. Reliance Communications Ltd locked at its lower circuit of 2.06% on 10 Jun 2026, with unfilled sell orders and a frozen price, signalling persistent selling pressure in a micro-cap stock with limited liquidity.
Read full news article
Reliance Communications Ltd Locks at Upper Circuit With 2.06% Gain — Buyers Queue, Sellers Absent
At Rs 1.01, the buying was done — not because demand dried up, but because the exchange wouldn't let the stock go any higher. Reliance Communications Ltd locked at its upper circuit of 2.06% on 8 Jun 2026, with buyers queuing and no sellers willing to part with shares.
Read full news article Announcements
Disclosure Under Regulation 30 Of The Securities And Exchange Board Of India (Listing Obligations And Disclosure Requirements) Regulations 2015: During A Routine Compliance Review Of Records Available On Companies House (United Kingdom) It Was Observed Th
10-Jun-2026 | Source : BSEDisclosure regarding Regulation 30 of LODR 2015 we wish to inform that during a routine compliance review of record available our company foreign step down subsidiary Reliance Communication (UK ) Limited is reflected Dissolved.
Corporate Insolvency Resolution Process (CIRP)-Intimation of meeting of Committee of Creditors
09-Jun-2026 | Source : BSEDisclosure regarding 72nd COC Meeting to be held on 09/06/2026
Disclosure Under Regulation 30-A Fire Incident Occurred At The CompanyS Office Premises Situated At IDC-2 Block Dhirubhai Ambani Knowledge City Koparkhairane Navi Mumbai 400710
04-Jun-2026 | Source : BSEDisclosure under Reg.30 of LODR (SEBI) Regulations 2015- A Fire incident occurred at the Companys office premises.
Corporate Actions

No Upcoming Board Meetings

Reliance Communications Ltd has declared 5% dividend, ex-date: 14 Aug 13

No Splits history available

No Bonus history available

No Rights history available
Quality key factors
Valuation key factors
Technicals key factors
 Technical Indicator Scale: Bearish, Mildly Bearish, Sideways, Mildly Bullish, Bullish Turned
 Shareholding Snapshot : Mar 2026
Shareholding Compare (%holding)
Non Institution
None
Held by 27 Schemes (0.01%)
Held by 71 FIIs (0.07%)
Rwtipl Industries Private Limited (0.31%)
Life Insurance Corporation Of India (4.13%)
86.06%
Quarterly Results Snapshot (Consolidated) - Mar'26 - QoQ

QoQ Growth in quarter ended Mar 2026 is 28.57% vs -27.59% in Dec 2025

QoQ Growth in quarter ended Mar 2026 is -11.93% vs -2.44% in Dec 2025
Half Yearly Results Snapshot (Consolidated) - Sep'25
Growth in half year ended Sep 2025 is -8.11% vs -6.09% in Sep 2024
Growth in half year ended Sep 2025 is -16.78% vs -48.96% in Sep 2024
Nine Monthly Results Snapshot (Consolidated) - Dec'25
YoY Growth in nine months ended Dec 2025 is -14.34% vs -6.53% in Dec 2024
YoY Growth in nine months ended Dec 2025 is -16.62% vs -35.40% in Dec 2024
Annual Results Snapshot (Consolidated) - Mar'26
YoY Growth in year ended Mar 2026 is -12.29% vs -6.53% in Mar 2025
YoY Growth in year ended Mar 2026 is -18.49% vs -30.19% in Mar 2025
About Reliance Communications Ltd

Company Coordinates


