
Compare Remi Edelstahl with Similar Stocks
Dashboard
Weak Long Term Fundamental Strength with an average Return on Capital Employed (ROCE) of 3.97%
- Poor long term growth as Net Sales has grown by an annual rate of 11.52% over the last 5 years
- Low ability to service debt as the company has a high Debt to EBITDA ratio of 6.72 times
Flat results in Mar 26
With ROCE of 3.7, it has a Very Expensive valuation with a 2.5 Enterprise value to Capital Employed
Stock DNA
Iron & Steel Products
INR 239 Cr (Micro Cap)
90.00
9
0.00%
0.74
3.94%
3.56
Total Returns (Price + Dividend) 
Latest dividend: 0.6500 per share ex-dividend date: Sep-24-2008
Risk Adjusted Returns v/s
Returns Beta

News

Remi Edelstahl Tubulars Ltd is Rated Sell
Remi Edelstahl Tubulars Ltd is rated 'Sell' by MarketsMOJO, with this rating last updated on 08 May 2026. However, the analysis and financial metrics presented here reflect the stock’s current position as of 27 July 2026, providing investors with the latest insights into its performance and outlook.
Read full news articleWhen is the next results date for Remi Edelstahl Tubulars Ltd?
The next results date for Remi Edelstahl Tubulars Ltd is scheduled for July 28, 2026....
Read full news article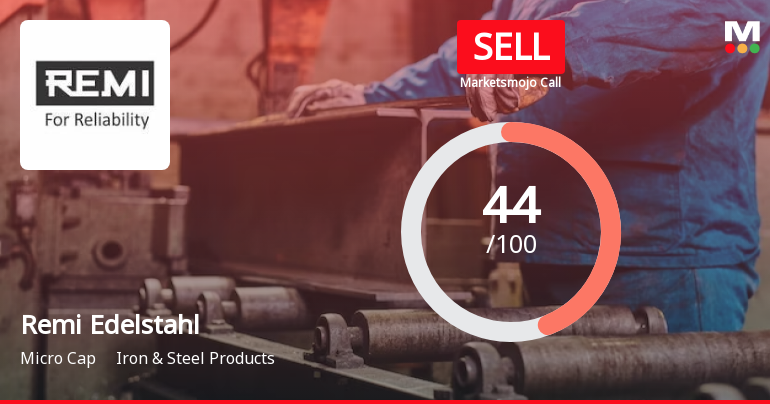
Remi Edelstahl Tubulars Ltd is Rated Sell
Remi Edelstahl Tubulars Ltd is rated 'Sell' by MarketsMOJO, with this rating last updated on 08 May 2026. However, the analysis and financial metrics discussed here reflect the stock's current position as of 16 July 2026, providing investors with an up-to-date view of the company’s fundamentals, valuation, financial trends, and technical outlook.
Read full news article Announcements
Board Meeting Intimation for Board Meeting Intimation For 1) The Unaudited Financial Results For The Quarter Ended June 30 2026; 2) The Fund Raising By Way Of Issue Of Equity Shares And/Or Warrants Through Preferential Issue 3) Any Other Business
21-Jul-2026 | Source : BSERemi Edelstahl Tubulars Ltdhas informed BSE that the meeting of the Board of Directors of the Company is scheduled on 28/07/2026 inter alia to consider and approve ) to consider and take on record the Unaudited Financial Results of the Company for the quarter ended June 30 2026; 2) to consider and approve the fund raising by way of issue of securities/ equity shares / warrants through right issue preferential issue qualified institutions placement or any methods or combination thereof including determination of issue subject to such regulatory / statuary approval as may be required. 3) any other business
Compliances-Certificate under Reg. 74 (5) of SEBI (DP) Regulations 2018
15-Jul-2026 | Source : BSECertificate under Reg.74(5) of SEBI (DP) Reg. 2018 for the quarter ended 30-06-2026
Closure of Trading Window
26-Jun-2026 | Source : BSEClosure of Trading Window-From 01/07/2026 till further communication
Corporate Actions

(28 Jul 2026)

Remi Edelstahl Tubulars Ltd has declared 15% dividend, ex-date: 24 Sep 08

No Splits history available

Remi Edelstahl Tubulars Ltd has announced 1:1 bonus issue, ex-date: 03 Nov 08

No Rights history available
Quality key factors
Valuation key factors
Technicals key factors
 Technical Indicator Scale: Bearish, Mildly Bearish, Sideways, Mildly Bullish, Bullish Turned
 Shareholding Snapshot : Jun 2026
Shareholding Compare (%holding)
Promoters
None
Held by 2 Schemes (0.07%)
Held by 0 FIIs
Remi Finance And Investment Private Limited (23.66%)
Wsg Co., Ltd. (5.31%)
20.52%
Quarterly Results Snapshot (Standalone) - Mar'26 - QoQ

QoQ Growth in quarter ended Mar 2026 is 39.04% vs 2.00% in Dec 2025
QoQ Growth in quarter ended Mar 2026 is 184.62% vs -62.14% in Dec 2025
Half Yearly Results Snapshot (Standalone) - Sep'25

Growth in half year ended Sep 2025 is 9.38% vs 13.35% in Sep 2024
Growth in half year ended Sep 2025 is -14.48% vs 680.00% in Sep 2024
Nine Monthly Results Snapshot (Standalone) - Dec'25
YoY Growth in nine months ended Dec 2025 is -3.72% vs 27.38% in Dec 2024
YoY Growth in nine months ended Dec 2025 is -28.51% vs 1,300.00% in Dec 2024
Annual Results Snapshot (Standalone) - Mar'26
YoY Growth in year ended Mar 2026 is 2.21% vs 18.30% in Mar 2025
YoY Growth in year ended Mar 2026 is 2.62% vs 92.09% in Mar 2025
About Remi Edelstahl Tubulars Ltd

Company Coordinates


