
Compare Remsons Ind. with Similar Stocks
Stock DNA
Auto Components & Equipments
INR 272 Cr (Micro Cap)
15.00
38
0.64%
0.50
12.57%
1.83
Total Returns (Price + Dividend) 
Latest dividend: 0.20055813953488374 per share ex-dividend date: Jun-03-2026
Risk Adjusted Returns v/s
Returns Beta

News
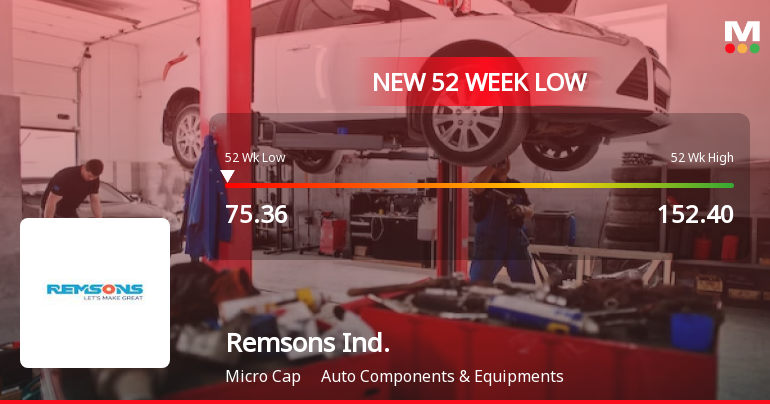
Remsons Industries Ltd Falls to 52-Week Low of Rs 75.36 as Sell-Off Deepens
For the sixth consecutive session, Remsons Industries Ltd has closed lower, culminating in a fresh 52-week low of Rs 75.36 on 15 Jul 2026. This marks an 11.81% decline over the past six trading days, a stark contrast to the broader market's upward momentum.
Read full news article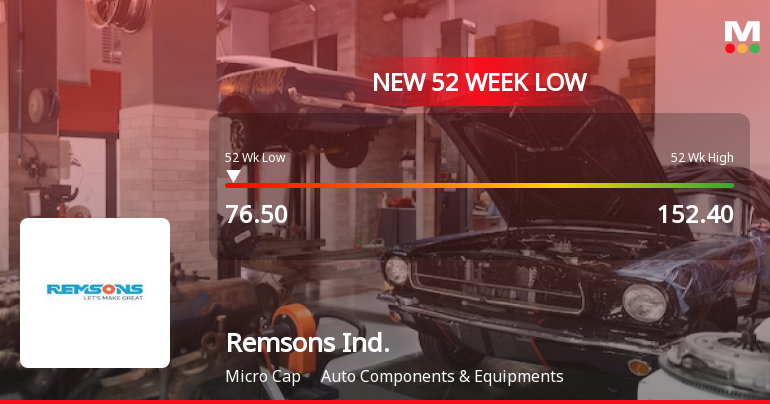
Five Consecutive Losses Push Remsons Industries Ltd to a New 52-Week Low
For the fifth straight session, Remsons Industries Ltd closed lower, breaching its 52-week low at Rs 76.5 on 14 Jul 2026. This marks a significant -10.09% decline over the past five days, underscoring persistent selling pressure despite some stabilisation in broader market indices.
Read full news article
Remsons Industries Ltd is Rated Sell
Remsons Industries Ltd is rated Sell by MarketsMOJO, with this rating last updated on 22 May 2026. However, the analysis and financial metrics discussed here reflect the stock’s current position as of 14 July 2026, providing investors with the most up-to-date perspective on the company’s performance and outlook.
Read full news article Announcements
Remsons Industries Limited - Updates
17-Oct-2019 | Source : NSERemsons Industries Limited has informed the Exchange regarding 'Confirmation under Regulation 74(5) of the SEBI (Depositories and Participants) Regulations, 2018'.
Shareholders meeting
16-Sep-2019 | Source : NSE
| Remsons Industries Limited has informed the Exchange regarding voting results of Annual General Meeting held on September 14, 2019 |
Updates
22-Aug-2019 | Source : NSE
| Remsons Industries Limited has informed the Exchange regarding 'Newspaper Advertisement- Notice of 47th Annual General Meeting, Remote e-voting information and Book Closure. '. |
Corporate Actions

No Upcoming Board Meetings

Remsons Industries Ltd has declared 10% dividend, ex-date: 03 Jun 26

Remsons Industries Ltd has announced 2:10 stock split, ex-date: 05 Jul 24

No Bonus history available

No Rights history available
Quality key factors
Valuation key factors
Technicals key factors
 Technical Indicator Scale: Bearish, Mildly Bearish, Sideways, Mildly Bullish, Bullish Turned
 Shareholding Snapshot : Mar 2026
Shareholding Compare (%holding)
Promoters
None
Held by 0 Schemes
Held by 5 FIIs (2.33%)
Chand Krishna Kejriwal (25.85%)
India Emerging Giants Fund Limited (1.95%)
25.65%
Quarterly Results Snapshot (Consolidated) - Mar'26 - QoQ

QoQ Growth in quarter ended Mar 2026 is 5.93% vs 6.50% in Dec 2025
QoQ Growth in quarter ended Mar 2026 is 1.95% vs 26.11% in Dec 2025
Half Yearly Results Snapshot (Consolidated) - Sep'25

Growth in half year ended Sep 2025 is 28.24% vs 12.57% in Sep 2024
Growth in half year ended Sep 2025 is 32.08% vs 22.48% in Sep 2024
Nine Monthly Results Snapshot (Consolidated) - Dec'25
YoY Growth in nine months ended Dec 2025 is 25.12% vs 16.90% in Dec 2024
YoY Growth in nine months ended Dec 2025 is 30.68% vs 20.07% in Dec 2024
Annual Results Snapshot (Consolidated) - Mar'26
YoY Growth in year ended Mar 2026 is 24.46% vs 20.58% in Mar 2025
YoY Growth in year ended Mar 2026 is 25.61% vs 7.88% in Mar 2025
About Remsons Industries Ltd

Company Coordinates


