
Compare Renaiss. Global with Similar Stocks
Dashboard
Weak Long Term Fundamental Strength with an average Return on Capital Employed (ROCE) of 8.67%
- Poor long term growth as Net Sales has grown by an annual rate of 6.73% and Operating profit at 18.93% over the last 5 years
Despite the size of the company, domestic mutual funds hold only 0% of the company
Below par performance in long term as well as near term
Stock DNA
Gems, Jewellery And Watches
INR 1,095 Cr (Micro Cap)
11.00
45
0.00%
0.34
6.82%
0.77
Total Returns (Price + Dividend) 
Latest dividend: 0.6 per share ex-dividend date: Jul-19-2022
Risk Adjusted Returns v/s
Returns Beta

News

Renaissance Global Ltd Technical Momentum Shifts Amid Mixed Market Signals
Renaissance Global Ltd, a micro-cap player in the Gems, Jewellery and Watches sector, has experienced a subtle shift in its technical momentum, moving from a bearish to a mildly bearish stance. Despite a modest day gain of 0.35%, the stock’s technical indicators present a complex picture, with mixed signals from MACD, RSI, moving averages, and other momentum oscillators. This analysis delves into the recent technical parameter changes and their implications for investors navigating this volatile micro-cap stock.
Read full news article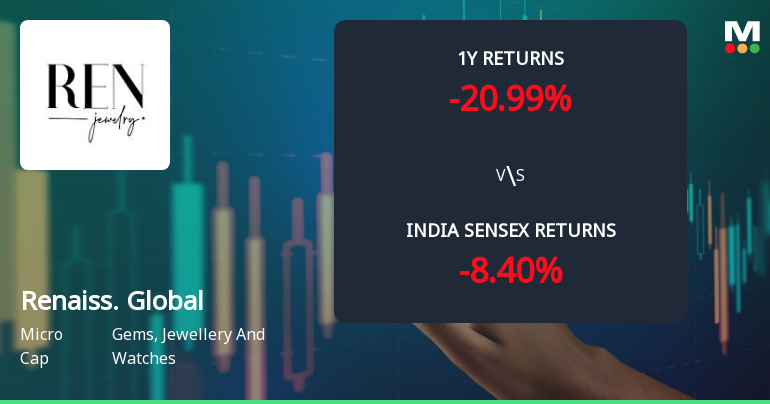
Renaissance Global Ltd Faces Bearish Momentum Amid Technical Downgrade
Renaissance Global Ltd, a micro-cap player in the Gems, Jewellery and Watches sector, has seen a notable shift in its technical momentum, prompting a downgrade in its Mojo Grade from Hold to Sell as of 29 Dec 2025. The stock’s price has declined by 3.14% today, reflecting growing bearish sentiment amid mixed technical signals and underperformance relative to key benchmarks.
Read full news articleAre Renaissance Global Ltd latest results good or bad?
Renaissance Global Ltd's latest financial results for Q4 FY26 present a mixed picture. The company reported a significant year-on-year growth in net sales of 50.35%, reaching ₹773.41 crores, compared to ₹514.40 crores in the same quarter of the previous year. This growth in revenue is notable; however, it was accompanied by a quarter-on-quarter decline of 19.68%, indicating volatility in sales performance. The net profit for the same quarter was ₹32.31 crores, reflecting a year-on-year increase of 28.98%. This marks an improvement from the previous year's profit of ₹25.05 crores. However, the profit after tax margin experienced a decline to 3.91% from 4.42% year-on-year, suggesting that while revenue grew, the company faced challenges in maintaining profitability margins. Operating margins showed a slight improvement, standing at 7.48%, which is marginally higher than the 7.42% recorded in the previous ye...
Read full news article Announcements
Renaissance Global Limited - Investor Presentation
13-Nov-2019 | Source : NSERenaissance Global Limited has informed the Exchange regarding Investor Presentation
Renaissance Global Limited - Analysts/Institutional Investor Meet/Con. Call Updates
25-Sep-2019 | Source : NSERenaissance Global Limited has informed the Exchange regarding Analysts/Institutional Investor Meet/Con. Call Updates
Analysts\/Institutional Investor Meet\/Con. Call Updates
17-Sep-2019 | Source : NSE
| Renaissance Global Limited has informed the Exchange regarding Analysts/Institutional Investor Meet/Con. Call UpdatesPursuant to Regulation 30 of the SEBI (Listing Obligations and Disclosure Requirements), Regulations, 2015, we refer to our letter Ref. No RGL/S&L/2019/128 dated September 10, 2019 intimating about the Analyst Meet of the Company on 12th September, 2019 and 13th September, 2019 In this regards, please note that the said meetings were held and we hereby submit the link of the presentation shared at the said Analyst Meets for your information and records. The aforesaid presentation is uploaded on the website of the Company at http://www.renjewellery.com/investor-relations/investor-relations_archive.asp?sec_id=10. |
Corporate Actions

No Upcoming Board Meetings

Renaissance Global Ltd has declared 30% dividend, ex-date: 19 Jul 22

Renaissance Global Ltd has announced 2:10 stock split, ex-date: 19 Jul 22

No Bonus history available

No Rights history available
Quality key factors
Valuation key factors
Technicals key factors
 Technical Indicator Scale: Bearish, Mildly Bearish, Sideways, Mildly Bullish, Bullish Turned
 Shareholding Snapshot : Mar 2026
Shareholding Compare (%holding)
Promoters
None
Held by 0 Schemes
Held by 8 FIIs (2.02%)
Anived Family Trust (sumit Niranjankumar Shah ) (19.82%)
None
22.97%
Quarterly Results Snapshot (Consolidated) - Mar'26 - YoY

YoY Growth in quarter ended Mar 2026 is 50.35% vs -4.12% in Mar 2025
YoY Growth in quarter ended Mar 2026 is 28.98% vs 27.22% in Mar 2025
Half Yearly Results Snapshot (Consolidated) - Sep'25
Growth in half year ended Sep 2025 is 25.72% vs -6.41% in Sep 2024

Growth in half year ended Sep 2025 is -4.18% vs 8.16% in Sep 2024
Nine Monthly Results Snapshot (Consolidated) - Dec'25
YoY Growth in nine months ended Dec 2025 is 30.20% vs -0.26% in Dec 2024
YoY Growth in nine months ended Dec 2025 is 13.07% vs -3.02% in Dec 2024
Annual Results Snapshot (Consolidated) - Mar'26
YoY Growth in year ended Mar 2026 is 35.18% vs -1.24% in Mar 2025
YoY Growth in year ended Mar 2026 is 18.31% vs 5.22% in Mar 2025
About Renaissance Global Ltd

Company Coordinates


