
Compare Rentokil Initial Plc with Similar Stocks
Dashboard
High Debt Company with a Debt to Equity ratio (avg) at times
- Poor long term growth as Operating profit has grown by an annual rate 26.42% of over the last 5 years
- High Debt Company with a Debt to Equity ratio (avg) at times
Healthy long term growth as Net Sales has grown by an annual rate of 14.81%
Flat results in Jun 25
With ROE of 9.94%, it has a very expensive valuation with a 2.48 Price to Book Value
Total Returns (Price + Dividend) 
Rentokil Initial Plc for the last several years.
Risk Adjusted Returns v/s
News
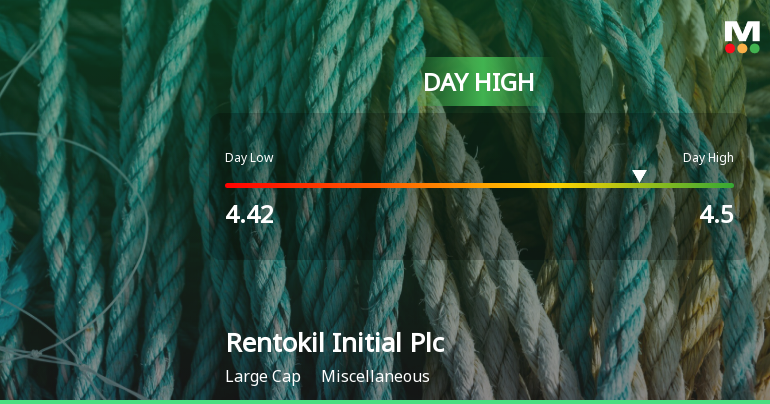
Rentokil Initial Plc Hits Day High with Strong 4.84% Intraday Surge
Rentokil Initial Plc has seen a significant rise today, outperforming the FTSE 100. Over the past week and month, the company has shown notable gains. However, its long-term performance reveals challenges, including a lower annual return compared to the FTSE 100 and a relatively high debt-to-equity ratio.
Read full news article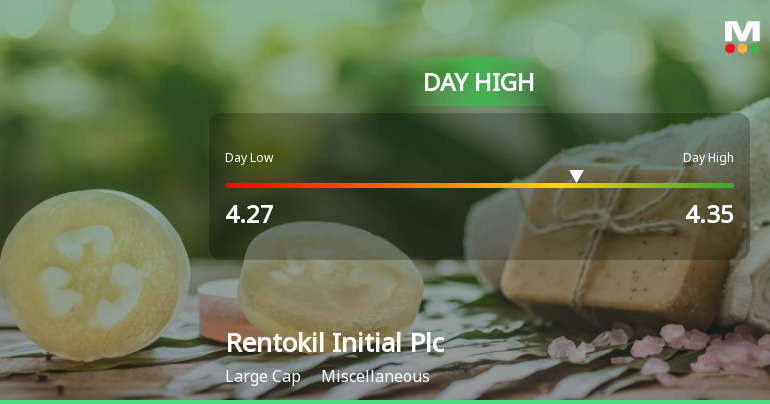
Rentokil Initial Plc Hits Day High with Strong 3.39% Intraday Surge
Rentokil Initial Plc experienced notable stock activity, outperforming the FTSE 100 in both weekly and monthly performance. However, its long-term returns lag behind the index. The company has a significant market capitalization and key financial indicators highlight both strengths and challenges in its financial health.
Read full news article Announcements

Corporate Actions
Quality key factors
Valuation key factors
Technicals key factors
 Technical Indicator Scale: Bearish, Mildly Bearish, Sideways, Mildly Bullish, Bullish Turned
 Shareholding Snapshot : Jun 2025
Shareholding Compare (%holding)
Foreign Institutions
Held in 0 Schemes (0%)
Held by 4 Foreign Institutions (0.44%)
Annual Results Snapshot (Consolidated) - Dec'23

YoY Growth in year ended Dec 2023 is 44.72% vs 25.73% in Dec 2022
YoY Growth in year ended Dec 2023 is 64.22% vs -11.85% in Dec 2022
About Rentokil Initial Plc

Company Coordinates


