
Compare Repay Holdings Corp. with Similar Stocks
Dashboard
Poor Management Efficiency with a low ROCE of 0.14%
- The company has been able to generate a Return on Capital Employed (avg) of 0.14% signifying low profitability per unit of total capital (equity and debt)
The company has declared negative results for the last 2 consecutive quarters
Risky -
Consistent Underperformance against the benchmark over the last 3 years
Total Returns (Price + Dividend) 
Repay Holdings Corp. for the last several years.
Risk Adjusted Returns v/s
News

Repay Holdings Corp. Hits New 52-Week Low at $2.98
Repay Holdings Corp. has reached a new 52-week low, reflecting a challenging year with a significant stock price decline. The company, with a market capitalization of USD 575 million, faces low profitability and increasing interest expenses, alongside inefficiencies in management, contributing to its underperformance against market benchmarks.
Read full news article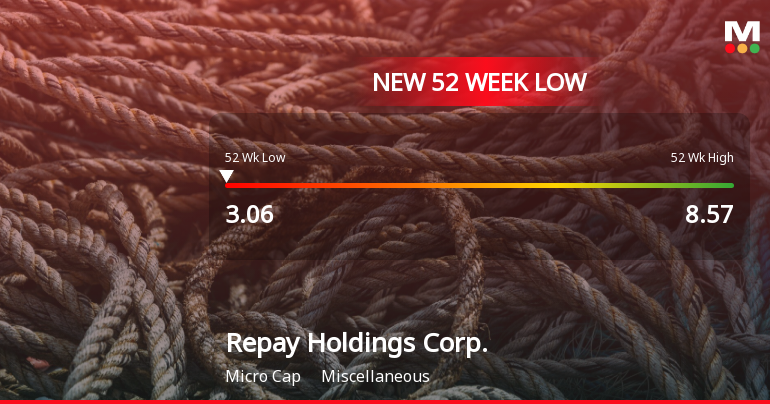
Repay Holdings Corp. Hits New 52-Week Low at $3.06
Repay Holdings Corp. has reached a new 52-week low of USD 3.06, reflecting a challenging year with a 71.31% decline in stock price. Despite a 68.6% increase in profits, the company faces low profitability and has consistently underperformed against the S&P 500 over the past three years.
Read full news article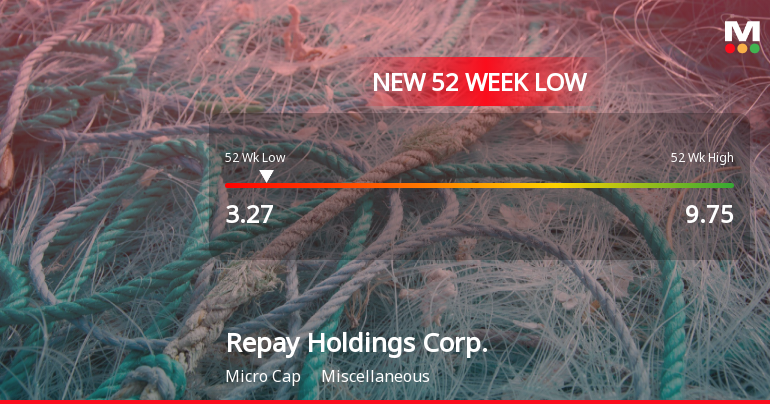
Repay Holdings Corp. Hits New 52-Week Low at $3.27
Repay Holdings Corp. has reached a new 52-week low, reflecting a difficult year with a significant stock price decline. The company, with a market capitalization of USD 575 million, faces profitability challenges, high interest expenses, and a negative return on capital employed, indicating ongoing financial struggles.
Read full news article Announcements

Corporate Actions
Quality key factors
Valuation key factors
Technicals key factors
 Technical Indicator Scale: Bearish, Mildly Bearish, Sideways, Mildly Bullish, Bullish Turned
 Shareholding Snapshot : Sep 2025
Shareholding Compare (%holding)
Domestic Funds
Held in 55 Schemes (54.11%)
Held by 77 Foreign Institutions (10.13%)
Quarterly Results Snapshot (Consolidated) - Sep'25 - YoY

YoY Growth in quarter ended Sep 2025 is -1.77% vs 6.46% in Sep 2024
YoY Growth in quarter ended Sep 2025 is -306.25% vs 149.23% in Sep 2024
Annual Results Snapshot (Consolidated) - Dec'24
YoY Growth in year ended Dec 2024 is 5.53% vs 6.23% in Dec 2023

YoY Growth in year ended Dec 2024 is 91.23% vs -1,449.43% in Dec 2023
About Repay Holdings Corp.

Company Coordinates


