
Compare Resonance Speci. with Similar Stocks
Dashboard
Company has a Debt to Equity ratio (avg) of 0.01 times
Poor long term growth as Operating profit has grown by an annual rate -0.94% of over the last 5 years
The company has declared Positive results for the last 7 consecutive quarters
With ROE of 14.2, it has a Expensive valuation with a 2.2 Price to Book Value
Majority shareholders : Promoters
Market Beating performance in long term as well as near term
Stock DNA
Specialty Chemicals
INR 156 Cr (Micro Cap)
15.00
43
0.75%
-0.14
14.20%
2.10
Total Returns (Price + Dividend) 
Latest dividend: 1 per share ex-dividend date: Jul-29-2025
Risk Adjusted Returns v/s
Returns Beta

News

Broad-Based Technical Strength Lifts Resonance Specialities Ltd to 52-Week High of Rs 147.25
With a decisive break above Rs 147.25 on 18 Jun 2026, Resonance Specialities Ltd has reached a new 52-week high, marking a 91% rally from its low of Rs 77 over the past year. This milestone is underpinned by a strong alignment of technical indicators and sustained price momentum, setting the stock apart in the Specialty Chemicals sector.
Read full news article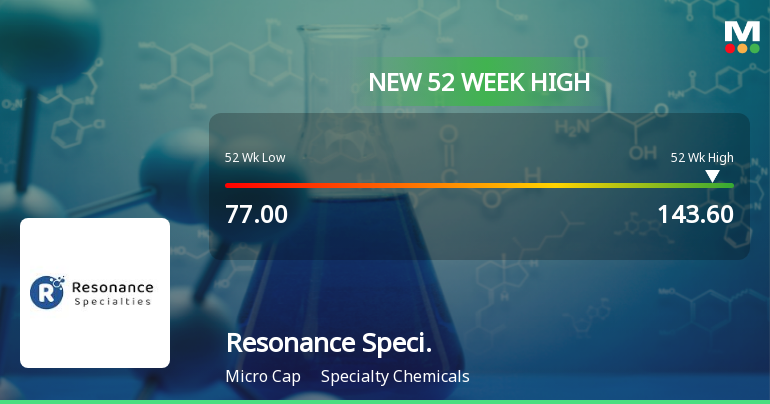
Broad-Based Technical Strength Lifts Resonance Specialities Ltd to 52-Week High of Rs 143.6
With a decisive surge to Rs 143.6 on 17 Jun 2026, Resonance Specialities Ltd has reached a fresh 52-week high, marking a 22.85% gain over the past year against the Sensex’s decline of 5.45%. This milestone reflects a strong alignment of technical indicators and sustained price momentum that has propelled the stock well above its key moving averages.
Read full news article
Resonance Specialities Ltd is Rated Hold
Resonance Specialities Ltd is rated Hold by MarketsMOJO, with this rating last updated on 15 Apr 2026. However, the analysis and financial metrics discussed here reflect the stock’s current position as of 14 June 2026, providing investors with the latest insights into its performance and outlook.
Read full news article Announcements
Closure of Trading Window
18-Jun-2026 | Source : BSEClosure of trading window
Compliances-Reg.24(A)-Annual Secretarial Compliance
15-May-2026 | Source : BSEAnnual Secretarial Compliance Report for the Financial Year 2025-26.
Announcement under Regulation 30 (LODR)-Newspaper Publication
15-May-2026 | Source : BSEFinancial Results published in Newspaper
Corporate Actions

No Upcoming Board Meetings

Resonance Specialities Ltd has declared 10% dividend, ex-date: 28 Jul 26

No Splits history available

No Bonus history available

No Rights history available
Quality key factors
Valuation key factors
Technicals key factors
 Technical Indicator Scale: Bearish, Mildly Bearish, Sideways, Mildly Bullish, Bullish Turned
 Shareholding Snapshot : Mar 2026
Shareholding Compare (%holding)
Promoters
None
Held by 0 Schemes
Held by 1 FIIs (0.03%)
Makers Laboratories Limited (45.48%)
Sangeetha S (1.57%)
35.29%
Quarterly Results Snapshot (Standalone) - Mar'26 - YoY

YoY Growth in quarter ended Mar 2026 is 1.16% vs 47.92% in Mar 2025
YoY Growth in quarter ended Mar 2026 is 50.33% vs 356.72% in Mar 2025
Half Yearly Results Snapshot (Standalone) - Sep'25
Growth in half year ended Sep 2025 is 21.03% vs 49.87% in Sep 2024
Growth in half year ended Sep 2025 is 37.66% vs 78.36% in Sep 2024
Nine Monthly Results Snapshot (Standalone) - Dec'25
YoY Growth in nine months ended Dec 2025 is 22.68% vs 37.67% in Dec 2024

YoY Growth in nine months ended Dec 2025 is 65.24% vs 52.61% in Dec 2024
Annual Results Snapshot (Standalone) - Mar'26
YoY Growth in year ended Mar 2026 is 15.99% vs 40.71% in Mar 2025
YoY Growth in year ended Mar 2026 is 58.30% vs 121.21% in Mar 2025
About Resonance Specialities Ltd

Company Coordinates


