
Compare Response Info. with Similar Stocks
Total Returns (Price + Dividend) 
Response Info. for the last several years.
Risk Adjusted Returns v/s
Returns Beta

News
Are Response Informatics Ltd latest results good or bad?
Response Informatics Ltd's latest financial results for Q4 FY26 reveal a complex picture of operational performance. The company reported a net profit of ₹1.36 crores, marking a significant increase from the previous quarter, primarily driven by margin expansion rather than revenue growth. The operating margin improved to 15.00%, up from 8.96% in Q3 FY26, indicating effective cost management, particularly through a reduction in employee costs. However, net sales declined by 7.51% quarter-on-quarter to ₹6.40 crores, reflecting stagnation in revenue generation. Year-on-year, sales showed a slight decline of 0.16%. This suggests that the profit surge was largely a result of cost control measures rather than an increase in sales activity, raising questions about the sustainability of such margins going forward. For the full fiscal year FY26, Response Informatics reported consolidated net sales of ₹26.30 crore...
Read full news article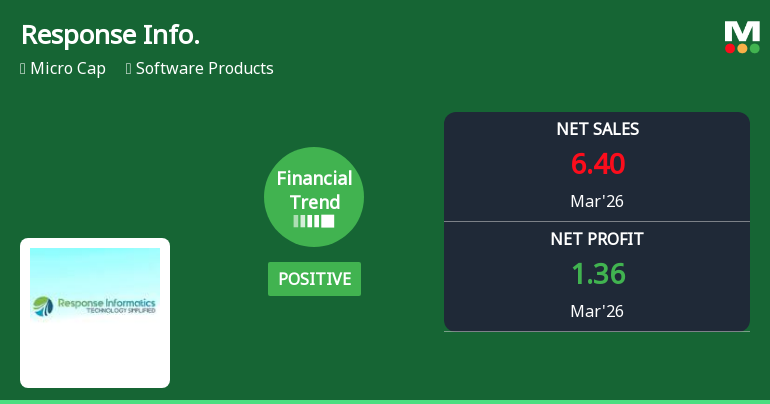
Response Informatics Ltd Reports Strong Quarterly Turnaround Amid Challenging Market Conditions
Response Informatics Ltd, a micro-cap player in the Software Products sector, has demonstrated a notable turnaround in its financial performance for the quarter ended March 2026. After a period of stagnation, the company’s financial trend has shifted from flat to positive, driven by record quarterly profits and margin expansion, despite ongoing market headwinds and a challenging stock price trajectory.
Read full news article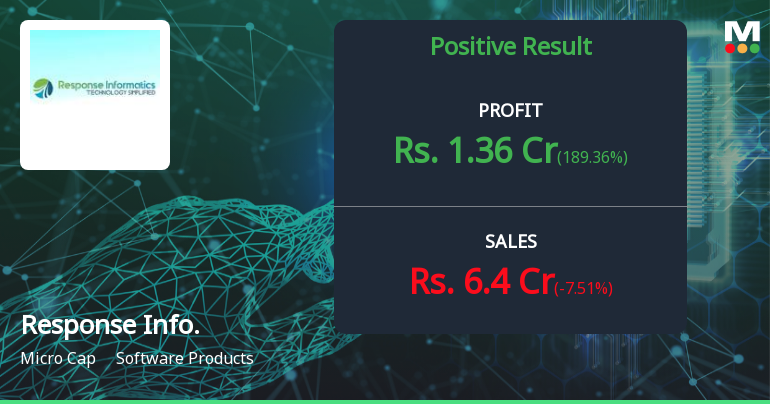
Response Informatics Q4 FY26: Profit Surge Masks Structural Concerns in Micro-Cap Software Play
Response Informatics Ltd., a Hyderabad-based software products company, reported consolidated net profit of ₹1.36 crores in Q4 FY26, marking a dramatic 189.36% quarter-on-quarter surge and 102.99% year-on-year growth. However, the impressive profit jump failed to arrest the stock's precipitous decline, with shares plunging 9.56% to ₹21.00 following the results announcement, bringing the micro-cap company's market capitalisation to just ₹19.00 crores. The stark divergence between quarterly profit performance and market reaction underscores deepening investor concerns about sustainability, governance issues stemming from 20.09% promoter pledging, and complete absence of institutional participation.
Read full news article Announcements
Announcement under Regulation 30 (LODR)-Newspaper Publication
31-May-2026 | Source : BSENewspaper Publication of the Audited Financial Results (standalone and Consolidated) for the Fourth quarter and Financial year ended on March 31st 2026.
Board Meeting Outcome for Financial Results For The Fourth Quarter And Year Ended 31St March 2026.
29-May-2026 | Source : BSEAudited Financial Results for the Fourth Quarter and Year ended 31st March 2026
Audited Financial Results For The Fourth Quarter And Financial Year Ended 31St March 2026
29-May-2026 | Source : BSEAudited Financial Results for the Fourth Quarter and Financial Year ended 31st March 2026
Corporate Actions

No Upcoming Board Meetings

No Dividend history available

No Splits history available

No Bonus history available

No Rights history available
Quality key factors
Valuation key factors
Technicals key factors
 Technical Indicator Scale: Bearish, Mildly Bearish, Sideways, Mildly Bullish, Bullish Turned
 Shareholding Snapshot : Mar 2026
Shareholding Compare (%holding)
Promoters
20.0872
Held by 0 Schemes
Held by 0 FIIs
Seetharaman Subramaniyam (38.26%)
Ganji Kishore Kumar (5.81%)
31.71%
Quarterly Results Snapshot (Consolidated) - Mar'26 - QoQ

QoQ Growth in quarter ended Mar 2026 is -7.51% vs 1.47% in Dec 2025

QoQ Growth in quarter ended Mar 2026 is 189.36% vs 46.87% in Dec 2025
Half Yearly Results Snapshot (Consolidated) - Sep'25
Growth in half year ended Sep 2025 is -30.85% vs -4.09% in Sep 2024
Growth in half year ended Sep 2025 is -71.11% vs -65.38% in Sep 2024
Nine Monthly Results Snapshot (Consolidated) - Dec'25
YoY Growth in nine months ended Dec 2025 is -26.76% vs -2.65% in Dec 2024
YoY Growth in nine months ended Dec 2025 is -48.23% vs -53.92% in Dec 2024
Annual Results Snapshot (Consolidated) - Mar'26
YoY Growth in year ended Mar 2026 is -21.65% vs -1.21% in Mar 2025
YoY Growth in year ended Mar 2026 is 0.48% vs -5.45% in Mar 2025
About Response Informatics Ltd

Company Coordinates


