
Compare Restile Ceramics with Similar Stocks
Dashboard
With a Negative Book Value, the company has a Weak Long Term Fundamental Strength
- Poor long term growth as Net Sales has grown by an annual rate of 25.29% and Operating profit at 0% over the last 5 years
- The company has a negative book value of Rs 31.72 crore
Flat results in Mar 26
Risky - Negative Operating Profits
Stock DNA
Diversified consumer products
INR 77 Cr (Micro Cap)
NA (Loss Making)
30
0.00%
-1.16
0.19%
-2.35
Total Returns (Price + Dividend) 
Restile Ceramics for the last several years.
Risk Adjusted Returns v/s
Returns Beta

News
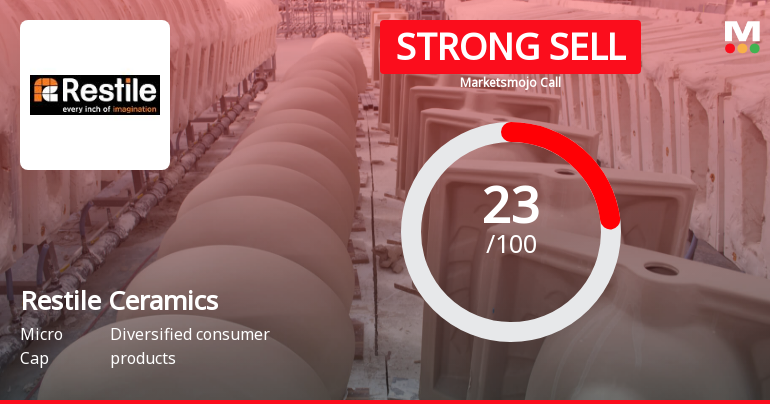
Restile Ceramics Ltd is Rated Strong Sell
Restile Ceramics Ltd is rated Strong Sell by MarketsMOJO, with this rating last updated on 24 Nov 2025. However, the analysis and financial metrics discussed here reflect the company’s current position as of 08 June 2026, providing investors with the latest insights into its fundamentals, valuation, financial trends, and technical outlook.
Read full news articleAre Restile Ceramics Ltd latest results good or bad?
Restile Ceramics Ltd's latest financial results for Q4 FY26 highlight significant operational challenges despite notable topline growth. The company reported net sales of ₹1.44 crores, reflecting a slight decline of 1.37% from the previous quarter but an impressive year-on-year growth of 311.43% compared to ₹0.35 crores in Q4 FY25. This year-on-year growth, however, is primarily attributed to a low base from the previous year when operations were constrained. The operational performance indicates a concerning trend, with an operating margin of -11.11%, which, while an improvement from -31.43% in Q4 FY25, shows a sharp decline from a positive margin of 30.46% achieved in Q3 FY26. The company recorded a net loss of ₹0.25 crores, which is a deterioration from the previous quarter's PAT margin of -13.01%, although it is an improvement from the -62.86% margin in Q4 FY25. The balance sheet reveals significant f...
Read full news article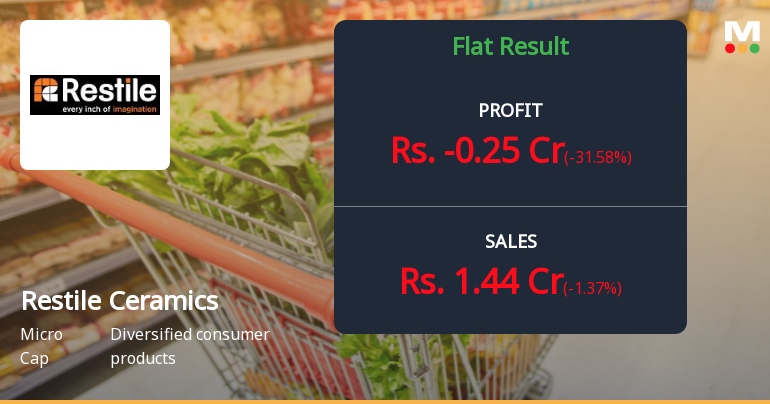
Restile Ceramics Q4 FY26: Losses Deepen Despite Revenue Surge
Restile Ceramics Ltd., a Vadodara-based manufacturer of vitrified ceramic floor and wall tiles, reported a net loss of ₹0.25 crores for Q4 FY26, marking a deterioration in profitability despite a remarkable 311.43% year-on-year revenue growth. The company's shares declined 2.15% to ₹7.27 on May 26, 2026, reflecting investor concerns about the widening losses and operational challenges that continue to plague the micro-cap ceramics maker.
Read full news article Announcements
Announcement under Regulation 30 (LODR)-Newspaper Publication
27-May-2026 | Source : BSEPlease find attached Newspaper Publication of the Audited Financial Results for the financial year ended March 31 2026
Board Meeting Outcome for Outcome Of The Board Meeting Held On Monday May 25 2026.
25-May-2026 | Source : BSEPursuant to Regulation 30 and 33 of the Securities and Exchange Board of India (Listing Obligations and Disclosure Requirements) Regulations 2015 we hereby inform you that the Board of Directors of the Company at their Meeting held today i.e. May 25 2026 have inter alia considered and approved the Audited Financial Statements including Balance Sheet as at March 31 2026 the Statement of profit and Loss and the Cash Flow Statement and notes thereon for the Financial Year ended March 31 2026 together with the Audit Report as on March 31 2026 and Audited Financial Results for the quarter and financial year ended March 31 2026 and affirms their satisfaction over the financial statements and results of the Company. You are requested to take the above information on record.
Compliances-Reg.24(A)-Annual Secretarial Compliance
25-May-2026 | Source : BSEPlease find enclosed Annual Secretarial Compliance Report for the Financial Year ended March 31 2026
Corporate Actions

No Upcoming Board Meetings

No Dividend history available

No Splits history available

No Bonus history available

Restile Ceramics Ltd has announced 26:35 rights issue, ex-date: 15 Sep 08
Quality key factors
Valuation key factors
Technicals key factors
 Technical Indicator Scale: Bearish, Mildly Bearish, Sideways, Mildly Bullish, Bullish Turned
 Shareholding Snapshot : Mar 2026
Shareholding Compare (%holding)
Promoters
None
Held by 5 Schemes (0.02%)
Held by 0 FIIs
Solomed Capital Pte Ltd (63.69%)
Springboard Pacific Enterprise Inc (14.59%)
8.05%
Quarterly Results Snapshot (Standalone) - Mar'26 - QoQ

QoQ Growth in quarter ended Mar 2026 is -1.37% vs -25.89% in Dec 2025
QoQ Growth in quarter ended Mar 2026 is -31.58% vs -138.78% in Dec 2025
Half Yearly Results Snapshot (Standalone) - Sep'25
Growth in half year ended Sep 2025 is 231.71% vs 49.09% in Sep 2024
Growth in half year ended Sep 2025 is 176.00% vs 3.85% in Sep 2024
Nine Monthly Results Snapshot (Standalone) - Dec'25
YoY Growth in nine months ended Dec 2025 is 283.49% vs 47.30% in Dec 2024
YoY Growth in nine months ended Dec 2025 is 125.68% vs -17.46% in Dec 2024
Annual Results Snapshot (Standalone) - Mar'26
YoY Growth in year ended Mar 2026 is 293.71% vs 52.13% in Mar 2025
YoY Growth in year ended Mar 2026 is 93.75% vs -5.49% in Mar 2025
About Restile Ceramics Ltd

Company Coordinates


