
Compare Rexnord Electr. with Similar Stocks
Stock DNA
Industrial Manufacturing
INR 122 Cr (Micro Cap)
21.00
46
0.00%
0.13
5.77%
1.22
Total Returns (Price + Dividend) 
Rexnord Electr. for the last several years.
Risk Adjusted Returns v/s
Returns Beta

News
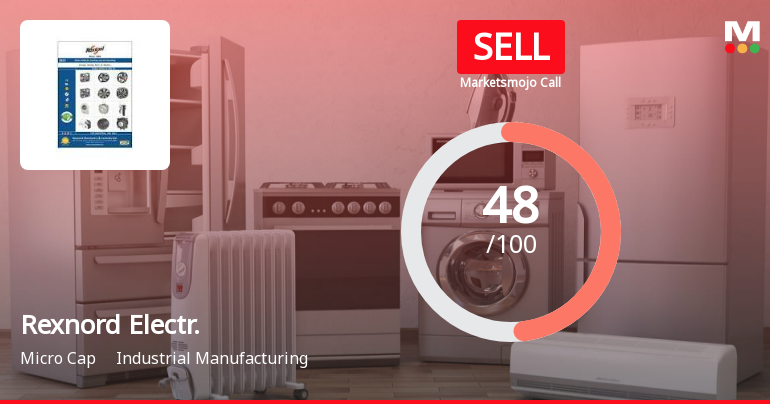
Rexnord Electronics & Controls Ltd is Rated Sell
Rexnord Electronics & Controls Ltd is rated 'Sell' by MarketsMOJO, with this rating last updated on 30 May 2026. While the rating was revised on that date, the analysis and financial metrics discussed here reflect the stock's current position as of 04 June 2026, providing investors with the latest insights into the company’s performance and outlook.
Read full news article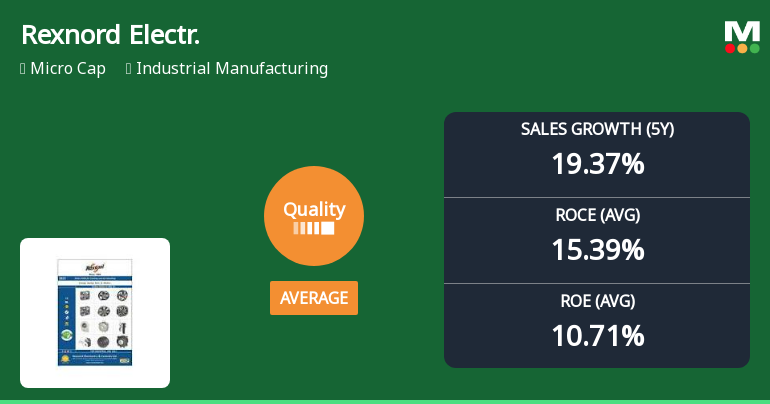
Rexnord Electronics & Controls Ltd: Quality Metrics Improve Amid Mixed Financial Performance
Rexnord Electronics & Controls Ltd has witnessed an upgrade in its quality grade from below average to average, reflecting a nuanced shift in its business fundamentals. Despite a micro-cap status and a Mojo Grade of Sell, the company’s financial metrics reveal areas of both improvement and concern, warranting a detailed analysis for investors seeking clarity on its operational health and future prospects.
Read full news articleAre Rexnord Electronics & Controls Ltd latest results good or bad?
Rexnord Electronics & Controls Ltd has reported notable financial results for the quarter ending March 2026, showcasing a quarter-on-quarter revenue growth of 14.98%, reaching ₹33.92 crores, and a remarkable year-on-year profit growth of 339.81%, with a net profit of ₹4.75 crores. This quarter's performance stands out as the highest revenue recorded in at least seven quarters, indicating potential improvements in demand or market positioning. The operating profit margin for the quarter surged to 30.20%, a significant increase from 3.29% in the previous quarter, reflecting a substantial operational turnaround. However, this dramatic margin expansion raises questions about its sustainability, given the company's historical volatility in performance and the challenges it faces in maintaining consistent operational efficiency. Despite the strong quarterly results, the company has shown a concerning trend in p...
Read full news article Announcements
Announcement under Regulation 30 (LODR)-Newspaper Publication
01-Jun-2026 | Source : BSERexnord Electronics and Controls Limited has submitted the clippings of Newspaper Publication of the Financial Results for the Quarter and Year ended March 31 2026.
Compliances-Reg.24(A)-Annual Secretarial Compliance
30-May-2026 | Source : BSERexnord Electronics and Controls Limited has submitted the Annual Secretarial Compliance Report for the year ended March 31 2026.
Announcement under Regulation 30 (LODR)-Change in Management
29-May-2026 | Source : BSERexnord Electronics and Controls Limited has submitted Announcement for re-appointment of Internal Auditor.
Corporate Actions

No Upcoming Board Meetings

No Dividend history available

No Splits history available

No Bonus history available

No Rights history available
Quality key factors
Valuation key factors
Technicals key factors
 Technical Indicator Scale: Bearish, Mildly Bearish, Sideways, Mildly Bullish, Bullish Turned
 Shareholding Snapshot : Mar 2026
Shareholding Compare (%holding)
Promoters
None
Held by 0 Schemes
Held by 0 FIIs
Kishore Chand Talwar (47.7%)
Sangeetha S (4.41%)
24.73%
Quarterly Results Snapshot (Consolidated) - Mar'26 - QoQ

QoQ Growth in quarter ended Mar 2026 is 14.98% vs 10.94% in Dec 2025
QoQ Growth in quarter ended Mar 2026 is 386.14% vs -672.41% in Dec 2025
Half Yearly Results Snapshot (Consolidated) - Sep'25

Growth in half year ended Sep 2025 is 9.55% vs 9.65% in Sep 2024
Growth in half year ended Sep 2025 is -41.90% vs -28.41% in Sep 2024
Nine Monthly Results Snapshot (Consolidated) - Dec'25
YoY Growth in nine months ended Dec 2025 is 13.91% vs 8.41% in Dec 2024
YoY Growth in nine months ended Dec 2025 is -95.65% vs -30.92% in Dec 2024
Annual Results Snapshot (Consolidated) - Mar'26
YoY Growth in year ended Mar 2026 is 12.06% vs 12.66% in Mar 2025
YoY Growth in year ended Mar 2026 is -1.40% vs -32.84% in Mar 2025
About Rexnord Electronics & Controls Ltd

Company Coordinates


