
Compare Rico Auto Inds with Similar Stocks
Dashboard
Low ability to service debt as the company has a high Debt to EBITDA ratio of 3.26 times
- Poor long term growth as Net Sales has grown by an annual rate of 11.01% over the last 5 years
- Low ability to service debt as the company has a high Debt to EBITDA ratio of 3.26 times
- The company has been able to generate a Return on Equity (avg) of 5.59% signifying low profitability per unit of shareholders funds
Healthy long term growth as Operating profit has grown by an annual rate 70.32%
Flat results in Mar 26
With ROCE of 8.2, it has a Attractive valuation with a 1.8 Enterprise value to Capital Employed
Stock DNA
Auto Components & Equipments
INR 1,996 Cr (Micro Cap)
35.00
37
0.35%
0.91
7.22%
2.51
Total Returns (Price + Dividend) 
Latest dividend: 0.5 per share ex-dividend date: Sep-09-2025
Risk Adjusted Returns v/s
Returns Beta

News

Broad-Based Technical Strength Lifts Rico Auto Industries Ltd to 52-Week High of Rs 148.65
Surging past its previous peaks, Rico Auto Industries Ltd touched a fresh 52-week high of Rs 148.65 on 19 Jun 2026, marking a remarkable rally of over 125% from its 52-week low of Rs 65.93. This milestone comes amid a sustained uptrend supported by a confluence of bullish technical indicators and strong price momentum.
Read full news article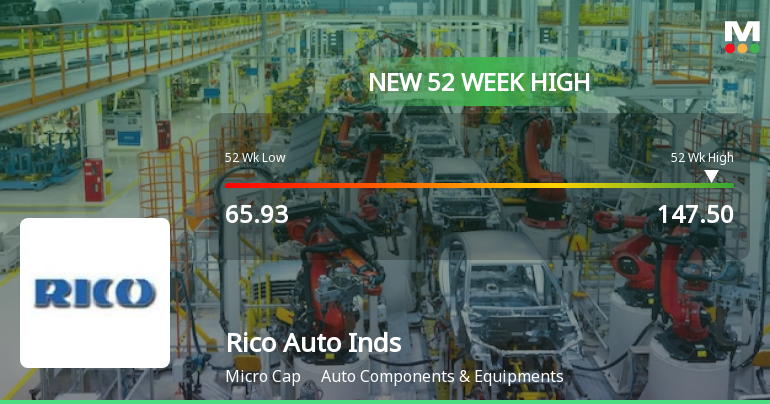
Broad-Based Technical Strength Lifts Rico Auto Industries Ltd to 52-Week High of Rs 147.5
Surging past its previous peak, Rico Auto Industries Ltd touched a fresh 52-week high of Rs 147.5 on 18 Jun 2026, marking an impressive rally of 87.61% over the past year against the Sensex's decline of 5.13%. This milestone underscores the stock’s robust price momentum and a confluence of bullish technical indicators that have propelled it higher.
Read full news article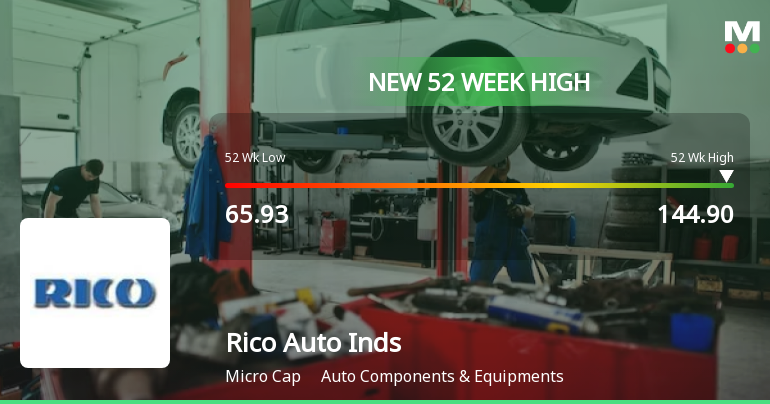
Broad-Based Technical Strength Lifts Rico Auto Industries Ltd to 52-Week High of Rs 144.9
With a remarkable 86.9% gain over the past year, Rico Auto Industries Ltd surged to a fresh 52-week high of Rs 144.9 on 17 Jun 2026, outpacing the Sensex which declined by 5.4% during the same period. This milestone caps a sustained rally fuelled by a confluence of bullish technical indicators and robust price momentum.
Read full news article Announcements
Rico Auto Industries Limited - Analysts/Institutional Investor Meet/Con. Call Updates
13-Nov-2019 | Source : NSERico Auto Industries Limited has informed the Exchange regarding Analysts/Institutional Investor Meet/Con. Call Updates
Rico Auto Industries Limited - Analysts/Institutional Investor Meet/Con. Call Updates
06-Nov-2019 | Source : NSERico Auto Industries Limited has informed the Exchange regarding Analysts/Institutional Investor Meet/Con. Call Updates
Rico Auto Industries Limited - Updates
25-Oct-2019 | Source : NSERico Auto Industries Limited has informed the Exchange regarding 'Published copy of Board Meeting Notice, in the following Newspapers:
Corporate Actions

No Upcoming Board Meetings

Rico Auto Industries Ltd has declared 50% dividend, ex-date: 09 Sep 25

No Splits history available

No Bonus history available

No Rights history available
Quality key factors
Valuation key factors
Technicals key factors
 Technical Indicator Scale: Bearish, Mildly Bearish, Sideways, Mildly Bullish, Bullish Turned
 Shareholding Snapshot : Mar 2026
Shareholding Compare (%holding)
Promoters
None
Held by 0 Schemes
Held by 33 FIIs (2.14%)
Asn Manufacturing And Services Private Limited (15.4%)
None
38.87%
Quarterly Results Snapshot (Consolidated) - Mar'26 - QoQ

QoQ Growth in quarter ended Mar 2026 is 7.64% vs 0.33% in Dec 2025

QoQ Growth in quarter ended Mar 2026 is -44.74% vs -37.52% in Dec 2025
Half Yearly Results Snapshot (Consolidated) - Sep'25
Growth in half year ended Sep 2025 is 4.96% vs 2.54% in Sep 2024
Growth in half year ended Sep 2025 is 178.12% vs -2.50% in Sep 2024
Nine Monthly Results Snapshot (Consolidated) - Dec'25
YoY Growth in nine months ended Dec 2025 is 7.98% vs 3.46% in Dec 2024
YoY Growth in nine months ended Dec 2025 is 218.68% vs -37.80% in Dec 2024
Annual Results Snapshot (Consolidated) - Mar'26
YoY Growth in year ended Mar 2026 is 11.99% vs 2.44% in Mar 2025
YoY Growth in year ended Mar 2026 is 167.25% vs -50.70% in Mar 2025
About Rico Auto Industries Ltd

Company Coordinates


