
Compare Rishabh Instrum. with Similar Stocks
Dashboard
Poor Management Efficiency with a low ROE of 7.31%
- The company has been able to generate a Return on Equity (avg) of 7.31% signifying low profitability per unit of shareholders funds
The company is Net-Debt Free
Poor long term growth as Net Sales has grown by an annual rate of 10.82% and Operating profit at 17.73% over the last 5 years
The company has declared Positive results for the last 4 consecutive quarters
With ROE of 10.9, it has a Expensive valuation with a 3.1 Price to Book Value
Increasing Participation by Institutional Investors
Stock DNA
Other Electrical Equipment
INR 2,334 Cr (Small Cap)
29.00
42
0.33%
-0.16
10.94%
3.15
Total Returns (Price + Dividend) 
Latest dividend: 1.9942390782525206 per share ex-dividend date: Jul-24-2026
Risk Adjusted Returns v/s
Returns Beta

News

Rishabh Instruments Ltd is Rated Hold by MarketsMOJO
Rishabh Instruments Ltd is rated 'Hold' by MarketsMOJO, with this rating last updated on 16 March 2026. However, the analysis and financial metrics discussed here reflect the company’s current position as of 27 July 2026, providing investors with an up-to-date perspective on the stock’s fundamentals, valuation, financial trends, and technical outlook.
Read full news article
Rishabh Instruments Ltd is Rated Hold by MarketsMOJO
Rishabh Instruments Ltd is rated 'Hold' by MarketsMOJO, a rating that was last updated on 16 Mar 2026. While the rating change occurred in March, the analysis and financial metrics discussed here reflect the company’s current position as of 16 July 2026, providing investors with an up-to-date view of the stock’s fundamentals, returns, and market performance.
Read full news article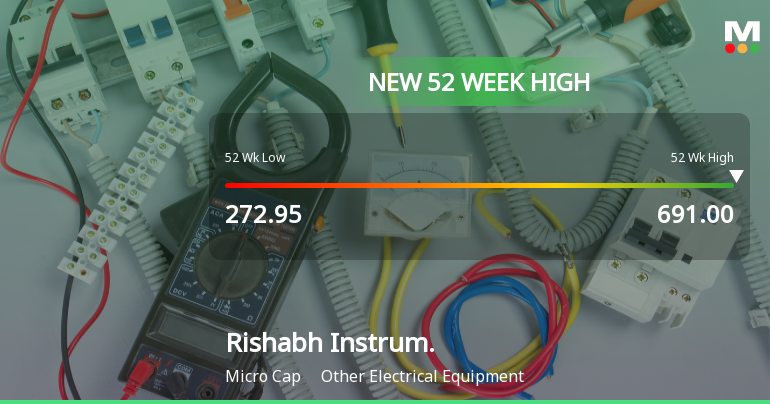
Broad-Based Technical Strength Lifts Rishabh Instruments Ltd to 52-Week High of Rs 689.15
Delivering a remarkable 147.6% return over the past year, Rishabh Instruments Ltd surged to an intraday high of Rs 689.15 on 8 Jul 2026, just 1.19% shy of its 52-week peak. This milestone caps a sustained rally that has outpaced the Sensex’s 7.1% decline over the same period, underscoring the stock’s robust momentum amid a mixed broader market backdrop.
Read full news article Announcements
Corporate Actions

No Upcoming Board Meetings

Rishabh Instruments Ltd has declared 20% dividend, ex-date: 24 Jul 26

No Splits history available

No Bonus history available

No Rights history available
Quality key factors
Valuation key factors
Technicals key factors
 Technical Indicator Scale: Bearish, Mildly Bearish, Sideways, Mildly Bullish, Bullish Turned
 Shareholding Snapshot : Jun 2026
Shareholding Compare (%holding)
Promoters
None
Held by 2 Schemes (8.4%)
Held by 12 FIIs (1.18%)
Narendra Joharimal Goliya Jointly With Asha Narendra Goliya (42.09%)
Quant Mutual Fund - Quant Small Cap Fund (4.91%)
14.71%
Quarterly Results Snapshot (Consolidated) - Mar'26 - QoQ

QoQ Growth in quarter ended Mar 2026 is 11.57% vs -6.47% in Dec 2025
QoQ Growth in quarter ended Mar 2026 is -1.40% vs -9.80% in Dec 2025
Half Yearly Results Snapshot (Consolidated) - Sep'25
Growth in half year ended Sep 2025 is 9.94% vs -0.24% in Sep 2024
Growth in half year ended Sep 2025 is 438.61% vs -73.79% in Sep 2024
Nine Monthly Results Snapshot (Consolidated) - Dec'25
YoY Growth in nine months ended Dec 2025 is 7.02% vs 4.11% in Dec 2024
YoY Growth in nine months ended Dec 2025 is 283.32% vs -56.71% in Dec 2024
Annual Results Snapshot (Consolidated) - Mar'26
YoY Growth in year ended Mar 2026 is 7.61% vs 4.43% in Mar 2025
YoY Growth in year ended Mar 2026 is 263.97% vs -43.52% in Mar 2025
About Rishabh Instruments Ltd

Company Coordinates


