
Compare RKEC Projects with Similar Stocks
Dashboard
Weak Long Term Fundamental Strength as the company has not declared results in the last 6 months
- Low ability to service debt as the company has a high Debt to EBITDA ratio of 5.91 times
- The company has been able to generate a Return on Equity (avg) of 8.91% signifying low profitability per unit of shareholders funds
With a fall in Operating Profit of -55.83%, the company declared Very Negative results in Dec 25
78.51% of Promoter Shares are Pledged
Total Returns (Price + Dividend) 
Latest dividend: 1.2 per share ex-dividend date: Sep-16-2021
Risk Adjusted Returns v/s
Returns Beta

News

RKEC Projects Ltd is Rated Strong Sell
RKEC Projects Ltd is rated Strong Sell by MarketsMOJO, with this rating last updated on 22 April 2025. However, the analysis and financial metrics discussed here reflect the stock's current position as of 10 July 2026, providing investors with an up-to-date view of the company’s performance and outlook.
Read full news article
RKEC Projects Ltd is Rated Strong Sell
RKEC Projects Ltd is rated Strong Sell by MarketsMOJO. This rating was last updated on 22 April 2025. However, the analysis and financial metrics discussed below reflect the stock’s current position as of 29 June 2026, providing investors with the most up-to-date view of the company’s performance and outlook.
Read full news article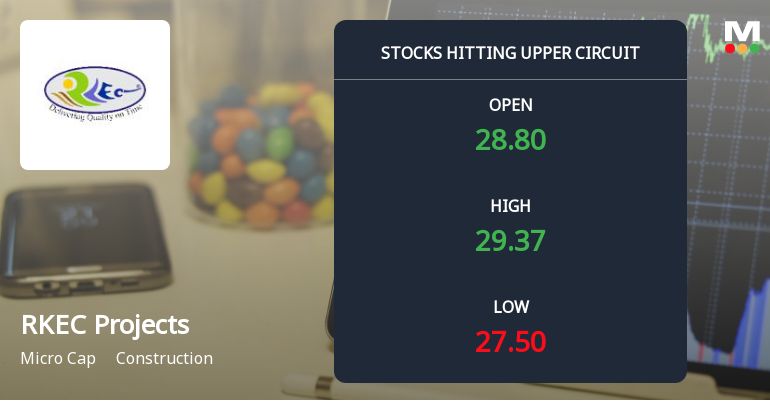
RKEC Projects Ltd Locks at Upper Circuit With 10.0% Gain — Buyers Queue, Sellers Absent
At Rs 29.37, the buying was done — not because demand dried up, but because the exchange wouldn't let the stock go any higher. RKEC Projects Ltd locked at its upper circuit of 10.0% on 19 Jun 2026, with buyers queuing and no sellers willing to part with shares.
Read full news article Announcements
RKEC Projects Limited - Outcome of Board Meeting
15-Nov-2019 | Source : NSERKEC Projects Limited has informed the Exchange regarding Board meeting held on November 14, 2019.
RKEC Projects Limited - Committee Meeting Updates
08-Nov-2019 | Source : NSERKEC Projects Limited has informed the Exchange regarding Committee Meeting to be held on November 14, 2019.
RKEC Projects Limited - Updates
04-Nov-2019 | Source : NSERKEC Projects Limited has informed the Exchange regarding 'Work Order for "Maintenance Dredging of Naval Berths at Jetty "X" in Naval Area at Visakhapatnam"'.
Corporate Actions

No Upcoming Board Meetings

RKEC Projects Ltd has declared 12% dividend, ex-date: 16 Sep 21

No Splits history available

No Bonus history available

No Rights history available
Quality key factors
Valuation key factors
Technicals key factors
 Technical Indicator Scale: Bearish, Mildly Bearish, Sideways, Mildly Bullish, Bullish Turned
 Shareholding Snapshot : Mar 2026
Shareholding Compare (%holding)
Promoters
78.5072
Held by 0 Schemes
Held by 2 FIIs (0.13%)
Garapati Radhakrishna (66.08%)
Shamoil Plumber (1.32%)
29.05%
Quarterly Results Snapshot (Consolidated) - Dec'25 - YoY

YoY Growth in quarter ended Dec 2025 is -72.56% vs 12.21% in Dec 2024
YoY Growth in quarter ended Dec 2025 is -79.30% vs -22.66% in Dec 2024
Half Yearly Results Snapshot (Consolidated) - Sep'25
Growth in half year ended Sep 2025 is -33.69% vs 69.29% in Sep 2024
Growth in half year ended Sep 2025 is -43.93% vs 139.68% in Sep 2024
Nine Monthly Results Snapshot (Consolidated) - Dec'25
YoY Growth in nine months ended Dec 2025 is -50.17% vs 39.25% in Dec 2024
YoY Growth in nine months ended Dec 2025 is -60.80% vs 19.78% in Dec 2024
Annual Results Snapshot (Consolidated) - Mar'25

YoY Growth in year ended Mar 2025 is 19.60% vs 17.46% in Mar 2024
YoY Growth in year ended Mar 2025 is 0.40% vs 62.81% in Mar 2024
About RKEC Projects Ltd

Company Coordinates


