RMC Switchgears

  • Market Cap: Micro Cap
  • Industry: Other Electrical Equipment
  • ISIN: INE655V01019
  • NSEID: RMC
  • BSEID: 540358
INR
229.18
3.21 (1.42%)
BSENSE

Sep 04, 01:06 PM

BSE+NSE Vol: 41.27 k

  • Price Points
  • Score
  • Mojo Parameters
  • Total Return
  • News and Corporate Actions
  • Key factors
  • Shareholding
  • Financials
  • CompanyCV
stock-summaryPrice Point
High/Low

1Day

52 Week

Valuation
Technical
Day's Volume

CASH

41.27 k (-23.92%) Volume

Shareholding (Jun 2026)

FII

2.70%

Held by 3 FIIs

DII

0.48%

Held by 0 DIIs

Promoter

51.97%

Why is RMC Switchgears Ltd falling/rising?

04-Sep-2026

As of 03-Sep, RMC Switchgears Ltd's stock price has risen to 225.75, marking a 1.76% increase after a period of decline. Despite today's positive movement, the stock has a year-to-date decline of 45.65% and a one-year drop of 70.47%, indicating ongoing challenges.

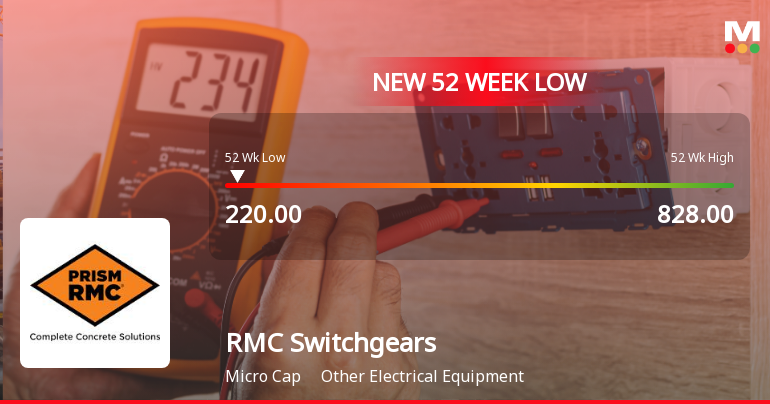
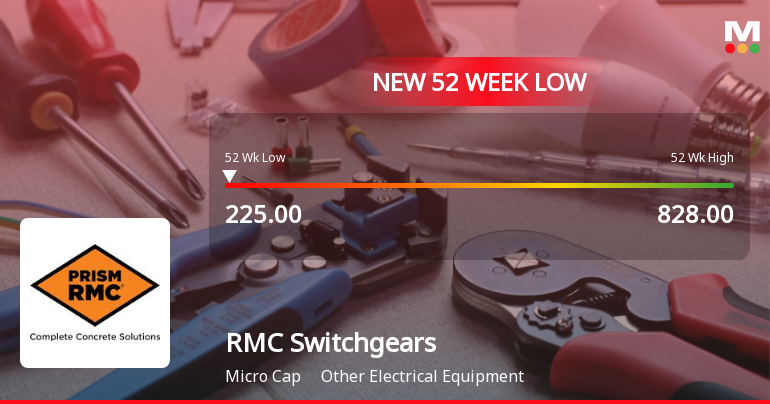
As of 03-Sep, RMC Switchgears Ltd is experiencing a rise in its stock price, currently at 225.75, which reflects an increase of 3.9 or 1.76%. This upward movement comes after a period of decline, as the stock has gained after five consecutive days of falling prices. Additionally, the stock outperformed its sector by 1.79% today, indicating a relative strength compared to its peers.<BR><BR>Despite the recent rise, the stock has faced significant challenges over the longer term, with a year-to-date decline of 45.65% and a one-year drop of 70.47%. However, today's performance included a notable intraday high of Rs 235.85, representing a 6.31% increase at its peak. <BR><BR>Investor participation appears to be increasing, as evidenced by a 56.39% rise in delivery volume compared to the five-day average, suggesting that more investors are willing to buy into the stock despite its recent lows. The stock also hit a new 52-week low of Rs 220 earlier in the day, which may have prompted some buying interest as investors look for potential recovery opportunities.<BR><BR>Overall, while RMC Switchgears Ltd has shown a positive movement today, it is important to consider the broader context of its significant declines over the past year and the ongoing challenges reflected in its moving averages, which indicate that it is trading below various key averages.

View full answer

Who are in the management team of RMC Switchgears?

01-Sep-2026

The management team of RMC Switchgears includes Ashok Kumar Agarwal (Chairman & Managing Director), Ankit Agrawal (Whole-time Director), Neha Agrawal (Executive Director), and several independent directors: Kuldeep Kumar Gupta, Krati Agarwal, and Shriram Vishwasrao Mane, along with Preeti Khatore (Company Secretary & Compliance Officer). They oversee the company's operations and strategic direction.

The management team of RMC Switchgears includes the following individuals:<BR><BR>1. **Ashok Kumar Agarwal** - Chairman & Managing Director<BR>2. **Ankit Agrawal** - Whole-time Director<BR>3. **Neha Agrawal** - Executive Director<BR>4. **Kuldeep Kumar Gupta** - Independent Director<BR>5. **Krati Agarwal** - Independent Director<BR>6. **Preeti Khatore** - Company Secretary & Compliance Officer<BR>7. **Shriram Vishwasrao Mane** - Independent Director<BR><BR>This team is responsible for overseeing the company's operations and strategic direction.

View full answer

What does RMC Switchgears do?

01-Sep-2026

RMC Switchgears Ltd, a Micro Cap company in the Other Electrical Equipment industry, was incorporated in 1994 and reported net sales of 37 Cr and a net profit of 2 Cr for June 2026. The company has a market cap of INR 254 Cr and key financial metrics include a P/E of 31.00 and a return on equity of 17.25%.

Overview:<BR>RMC Switchgears Ltd operates in the Other Electrical Equipment industry and is classified as a Micro Cap company.<BR><BR>History:<BR>The company was originally incorporated in 1994 as "RFH Metal Castings Private Limited" in Rajasthan. It later became a Public Limited Company and changed its name to "RFH Metal Castings Limited" in December 2008. The latest quarterly results reported net sales and net profit for June 2026.<BR><BR>Financial Snapshot:<BR>Net Sales: 37 Cr (Quarterly Results - Jun 2026) <BR>Net Profit: 2 Cr (Quarterly Results - Jun 2026) <BR>Market Cap: INR 254 Cr (Micro Cap)<BR><BR>Key Metrics:<BR>P/E: 31.00 <BR>Industry P/E: 56 <BR>Dividend Yield: 0.00% <BR>Debt Equity: 0.71 <BR>Return on Equity: 17.25% <BR>Price to Book: 2.00 <BR><BR>Contact Details:<BR>Address: 7 KM From Chaksu Khotkawda Road, Tehsil Chaksu Tonk Road Jaipur Rajasthan : 303901 <BR>Tel: 91-141-4031516/4400222 <BR>Email: info@rmcindia.in <BR>Website: http://www.rmcindia.in

View full answer

Who are the peers of the RMC Switchgears?

01-Sep-2026

RMC Switchgears' peers include Sugs Lloyd, Artemis Electri., Kaycee Inds., Power & Instrum., Akanksha Power, Sahaj Solar, and Focus Lighting. RMC Switchgears has good management risk and growth, but its 1-year return is the lowest at -70.48% among its peers.

Peers: The peers of RMC Switchgears are Sugs Lloyd, Artemis Electri., Kaycee Inds., Power & Instrum., Akanksha Power, Sahaj Solar, and Focus Lighting.<BR><BR>Quality Snapshot: Excellent management risk is observed at Sugs Lloyd, Kaycee Inds., Sahaj Solar, and Focus Lighting, while Good management risk is found at RMC Switchgears. Below Average management risk is noted for Artemis Electri. and Akanksha Power. Growth is Excellent for Sugs Lloyd and Sahaj Solar, Good for RMC Switchgears and Kaycee Inds., and Average for Akanksha Power. Average growth is also seen at Artemis Electri. and Power & Instrum. Capital Structure is Excellent at Kaycee Inds. and Akanksha Power, Good at Artemis Electri. and Power & Instrum., and Average at RMC Switchgears and Sahaj Solar.<BR><BR>Return Snapshot: Sugs Lloyd has the highest 1-year return at N/A, while RMC Switchgears has the lowest at -70.48%, indicating a significant decline compared to its peers. Additionally, Power & Instrum., Artemis Electri., Kaycee Inds., and RMC Switchgears all have negative six-month returns.

View full answer

How big is RMC Switchgears?

01-Sep-2026

As of 31st August, RMC Switchgears Ltd has a market capitalization of 254.00 Cr, with recent net sales of 301.75 Cr and a net profit of 8.40 Cr.

As of 31st August, RMC Switchgears Ltd has a market capitalization of 254.00 Cr, categorizing it as a Micro Cap company.<BR><BR>In the latest four quarters, RMC Switchgears reported Net Sales of 301.75 Cr and a Net Profit of 8.40 Cr.<BR><BR>The latest annual period for the balance sheet is March 2026, with Shareholder's Funds amounting to 130.46 Cr and Total Assets of 366.88 Cr.

View full answer

Should I buy, sell or hold RMC Switchgears Ltd?

14-Aug-2026

Are RMC Switchgears Ltd latest results good or bad?

12-Aug-2026

RMC Switchgears Ltd's latest Q4 FY26 results show a strong recovery with a net profit of ₹9.27 crores and a 285.91% increase in revenue to ₹142.94 crores. However, the company's past volatility raises concerns about the sustainability of this growth, suggesting that investors should exercise caution.

RMC Switchgears Ltd's latest results for Q4 FY26 indicate a significant recovery compared to the previous quarter. The company reported a net profit of ₹9.27 crores, a turnaround from a loss of ₹7.07 crores in Q3 FY26. Additionally, revenue surged by an impressive 285.91% quarter-on-quarter to ₹142.94 crores, following a substantial decline in the previous quarter.<BR><BR>While these figures demonstrate a dramatic recovery, it's important to note that the company's performance has been highly volatile. The revenue fluctuations—from ₹165.66 crores in Q4 FY25 to just ₹37.04 crores in Q3 FY26—raise concerns about the sustainability of this growth and the overall business model. The operating margin improved to 12.31%, a positive sign, but it still reflects the challenges the company faces in maintaining consistent performance.<BR><BR>Overall, while the latest results show a positive trend, the extreme volatility and past performance issues suggest caution. Investors should be aware of the operational challenges that could impact future stability.

View full answer

When is the next results date for RMC Switchgears Ltd?

11-Aug-2026

The next results date for RMC Switchgears Ltd is 12 August 2026.

The next results date for RMC Switchgears Ltd is scheduled for 12 August 2026.

View full answer

Is RMC Switchgears overvalued or undervalued?

03-Dec-2025

As of December 2, 2025, RMC Switchgears is considered expensive and overvalued with a PE ratio of 14.73, despite being lower than peers like Siemens Energy and ABB, and has experienced a significant year-to-date stock price decline of -60.76%.

As of 2 December 2025, the valuation grade for RMC Switchgears has moved from very expensive to expensive. The company appears to be overvalued based on its current financial metrics. Key ratios include a PE ratio of 14.73, an EV to EBIT of 10.66, and an ROCE of 25.74%. <BR><BR>In comparison to peers, RMC Switchgears has a lower PE ratio than Siemens Energy Industries, which stands at 103.35, and ABB at 62.31, both categorized as very expensive. Additionally, BHEL, also expensive, has a significantly higher PE ratio of 178.02. Despite the recent decline in stock price, which has seen a year-to-date return of -60.76% compared to a Sensex return of 8.96%, the valuation metrics suggest that RMC Switchgears is not positioned favorably in the current market landscape.

View full answer

How has been the historical performance of RMC Switchgears?

04-Nov-2025

RMC Switchgears has exhibited significant financial growth, with net sales increasing from 83.12 Cr in Mar'18 to 318.16 Cr in Mar'25, and profit after tax rising from 2.52 Cr to 31.46 Cr in the same period. The company has also improved its operating profit and cash flow, reflecting a strong upward trend in overall performance.

Answer:<BR>The historical performance of RMC Switchgears shows significant growth in various financial metrics over the years.<BR><BR>Breakdown:<BR>RMC Switchgears has demonstrated a strong upward trend in net sales, increasing from 83.12 Cr in Mar'18 to 318.16 Cr in Mar'25. Total operating income followed a similar trajectory, rising from 83.12 Cr in Mar'18 to 318.16 Cr in Mar'25. The raw material cost surged from 41.04 Cr in Mar'18 to 223.51 Cr in Mar'25, reflecting the company's expansion. Operating profit (PBDIT) also improved significantly, climbing from 9.84 Cr in Mar'18 to 54.48 Cr in Mar'25, although the operating profit margin declined from 10.63% in Mar'18 to 16.73% in Mar'25. Profit before tax increased from 3.01 Cr in Mar'18 to 42.66 Cr in Mar'25, with profit after tax reaching 31.46 Cr in Mar'25, up from 2.52 Cr in Mar'18. The company's total liabilities rose from 81.65 Cr in Mar'18 to 155.18 Cr in Mar'24, while total assets increased from 81.65 Cr in Mar'18 to 155.18 Cr in Mar'24, indicating robust growth. Cash flow from operating activities improved, showing a positive trend with a cash inflow of 7.00 Cr in Mar'24 compared to 0.23 Cr in Mar'18. Overall, RMC Switchgears has shown a remarkable growth trajectory in its financial performance over the years.

View full answer

Is RMC Switchgears technically bullish or bearish?

24-Sep-2025

As of September 23, 2025, RMC Switchgears is in a bearish trend, supported by bearish signals from the weekly MACD, RSI, and daily moving averages, despite some mixed indicators from the Dow Theory and monthly Bollinger Bands.

As of 23 September 2025, the technical trend for RMC Switchgears has changed from mildly bearish to bearish. The current technical stance is bearish, with moderate strength indicated by the weekly MACD and RSI both showing bearish signals. The daily moving averages confirm a bearish outlook, while the weekly Bollinger Bands also indicate bearish conditions. Although the monthly Bollinger Bands are mildly bullish, they do not outweigh the overall bearish sentiment from other indicators. The Dow Theory presents a mixed view with a mildly bullish weekly signal but a bearish monthly signal. Overall, the combination of these indicators suggests a bearish trend for RMC Switchgears.

View full answer

Who are the top shareholders of the RMC Switchgears?

17-Jul-2025

The top shareholders of RMC Switchgears include promoter Ashok Kumar Agarwal with 22.67%, foreign institutional investors holding 5.05%, and India Emerging Giants Fund Limited as the largest public shareholder at 5.03%. Individual investors own 34.79% of the shares, with no pledged promoter holdings or mutual fund investments.

The top shareholders of RMC Switchgears include the promoters, who hold the majority of the shares. The promoter with the highest holding is Ashok Kumar Agarwal, owning 22.67% of the company. Additionally, foreign institutional investors (FIIs) hold 5.05% through three different FIIs. The highest public shareholder is India Emerging Giants Fund Limited, which holds 5.03%. Individual investors collectively own 34.79% of the shares. There are no pledged promoter holdings, and no mutual funds are currently invested in the company.

View full answer

What is the bonus history of the RMC Switchgears?

06-Jun-2025

RMC Switchgears recently issued a 1:2 bonus, with an ex-date of October 13, 2023, meaning shareholders receive one additional share for every two shares held. This is the latest update on their bonus history.

RMC Switchgears has a recent bonus issue where they announced a 1:2 bonus. The ex-date for this bonus was on October 13, 2023. This means that for every two shares held, shareholders will receive one additional share. This is the latest information regarding their bonus history. If you have any more questions about the company or its financials, feel free to ask!

View full answer

Has RMC Switchgears declared dividend?

06-Jun-2025

RMC Switchgears Ltd has declared a 2% dividend, with an ex-date of November 21, 2023. Despite this, the dividend yield is 0%, while total returns over various periods show significant price appreciation, particularly in the long term.

RMC Switchgears Ltd has declared a 2% dividend.<BR><BR>Dividend Details:<BR>- Percentage announced: 2%<BR>- Ex-date: 21 Nov 23<BR><BR>Dividend Yield: 0%<BR><BR>Total Returns by Period:<BR>In the last 6 months, the price return was -12.32%, with a dividend return of 0%, resulting in a total return of -12.32%.<BR><BR>Over the past year, the price return was 87.77%, with a dividend return of 0%, leading to a total return of 87.77%.<BR><BR>In the 2-year period, the price return was 279.95%, with a dividend return of 0.10%, giving a total return of 280.05%.<BR><BR>For the 3-year period, the price return was 3758.9%, with a dividend return of 1.24%, resulting in a total return of 3760.14%.<BR><BR>In the last 4 years, the price return was 7163.81%, with a dividend return of 1.84%, leading to a total return of 7165.65%.<BR><BR>Over the past 5 years, the price return was 5923.65%, with a dividend return of 1.87%, resulting in a total return of 5925.52%.<BR><BR>Overall, RMC Switchgears has declared a dividend, but the dividend yield remains at 0%. The total returns over various periods show significant price appreciation, particularly over the longer term, indicating strong performance despite the lack of substantial dividend returns.

View full answer
iScoreScore
Click here to find our call on this stock
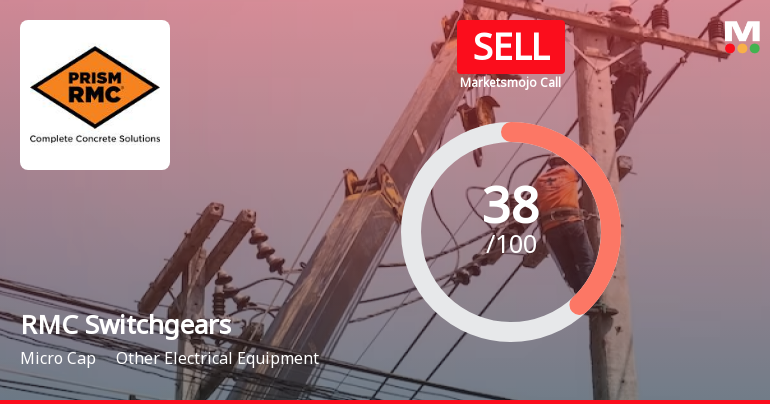
Strong Sell
Sell
Hold
Buy
Strong Buy

Dashboard

1

Negative results in Jun 26

  • NET SALES(Q) At Rs 31.85 cr has Fallen at -80.56%
  • PBT LESS OI(Q) At Rs 1.10 cr has Fallen at -91.59%
  • PAT(Q) At Rs 1.15 cr has Fallen at -88.3%
stock-summaryMojo Parameters

Mojo Parameters

Loading Valuation Snapshot...

Stock DNA

stock-summary
Industry

Other Electrical Equipment

stock-summary
Market cap

INR 243 Cr (Micro Cap)

stock-summary
P/E

29.00

stock-summary
Industry P/E

56

stock-summary
Dividend Yield

0.00%

stock-summary
Debt Equity

0.71

stock-summary
Return on Equity

17.25%

stock-summary
Price to Book

1.85

Revenue and Profits:
Net Sales:
37 Cr
(Quarterly Results - Jun 2026)
Net Profit:
2 Cr
stock-summaryTotal Returns
Total Returns (Price + Dividend) stock-summary
Dividend Yield (0%)
TimePeriod
Price Return
Dividend Return
Total Return
3 Months
-27.62%
0%
-27.62%
6 Months
0%
0%
0.0%
1 Year
0%
0%
0.0%
2 Years
0%
0%
0.0%
3 Years
0%
0%
0.0%
4 Years
0%
0%
0.0%
5 Years
0%
0%
0.0%

Latest dividend: 0.2 per share ex-dividend date: Nov-21-2023

Risk Adjusted Returns v/s stock-summary
Returns Beta
Icon
Beta has not been calculated since enough price history is not available
stock-summaryNews & Corporate Actions

Announcements stock-summary

Icon
No announcement available

Corporate Actions stock-summary

stock-summary
BOARD MEETING

No Upcoming Board Meetings

stock-summary
DIVIDEND

RMC Switchgears Ltd has declared 2% dividend, ex-date: 21 Nov 23

stock-summary
SPLITS

No Splits history available

stock-summary
BONUS

RMC Switchgears Ltd has announced 1:2 bonus issue, ex-date: 13 Oct 23

stock-summary
RIGHTS

No Rights history available

stock-summaryKey Factors

Quality key factors stock-summary

Factor
Value
Sales Growth (5y)
47.50%
EBIT Growth (5y)
21.96%
EBIT to Interest (avg)
3.49
Debt to EBITDA (avg)
1.45
Net Debt to Equity (avg)
0.71
Sales to Capital Employed (avg)
1.66
Tax Ratio
26.18%
Dividend Payout Ratio
0
Pledged Shares
0
Institutional Holding
3.18%
ROCE (avg)
26.16%
ROE (avg)
32.77%

Valuation key factors

Factor
Value
P/E Ratio
29
Industry P/E
56
Price to Book Value
1.85
EV to EBIT
7.85
EV to EBITDA
7.09
EV to Capital Employed
1.50
EV to Sales
0.83
PEG Ratio
NA
Dividend Yield
NA
ROCE (Latest)
19.11%
ROE (Latest)
17.25%

Technicals key factors

Indicator
Weekly
Monthly
MACD
Bearish
Bearish
RSI
No Signal
No Signal
Bollinger Bands
Bearish
Bearish
Moving Averages
Bearish (Daily)
KST
Bearish
Bearish
Dow Theory
Mildly Bearish
Mildly Bearish
OBV
Mildly Bearish
No Trend
stock-summary Technical Indicator Scale: Bearish, Mildly Bearish, Sideways, Mildly Bullish, Bullish  Turned 
stock-summaryShareholding
Shareholding Snapshot : Jun 2026stock-summary
Shareholding Compare (%holding) stock-summary
Majority shareholders

Promoters

Pledged Promoter Holdings

None

Mutual Funds

Held by 0 Schemes

FIIs

Held by 3 FIIs (2.7%)

Promoter with highest holding

Ashok Kumar Agarwal (22.64%)

Highest Public shareholder

Iegfl - Multi Opportunity (2.68%)

Individual Investors Holdings

35.73%

stock-summaryFinancial
[
  {
    "link": "quarterly",
    "btn_text": "All Quarterly Results",
    "header": "Quarterly Results Snapshot (Standalone) - Jun'26 - YoY",
    "rhs": [
      {
        "prefix": "Net Sales ",
        "suffix": "Not Applicable: The company has declared_date for only one period",
        "dir": 0
      },
      {
        "prefix": "Standalone Net Profit ",
        "suffix": "Not Applicable: The company has declared_date for only one period",
        "dir": 0
      }
    ],
    "table": {
      "header": [
        "Jun'26",
        "Jun'25",
        "Change(%)"
      ],
      "body": [
        {
          "field": "Net Sales",
          "val1": "31.85",
          "val2": "75.88",
          "chgp": "-58.03%",
          "chgp_class": "negative"
        },
        {
          "field": "Operating Profit (PBDIT) excl Other Income",
          "val1": "6.29",
          "val2": "6.81",
          "chgp": "-7.64%",
          "chgp_class": "negative"
        },
        {
          "field": "Interest",
          "val1": "4.04",
          "val2": "2.72",
          "chgp": "48.53%",
          "chgp_class": "negative"
        },
        {
          "field": "Exceptional Items",
          "val1": "0.00",
          "val2": "0.00",
          "chgp": "",
          "chgp_class": "neutral"
        },
        {
          "field": "Standalone Net Profit",
          "val1": "1.15",
          "val2": "2.53",
          "chgp": "-54.55%",
          "chgp_class": "negative"
        },
        {
          "field": "Operating Profit Margin (Excl OI)",
          "val1": "19.75%",
          "val2": "8.97%",
          "chgp": "10.78%",
          "chgp_class": "positive"
        }
      ]
    }
  },
  {
    "link": "half-yearly",
    "btn_text": "All Half Yearly Results",
    "header": "Half Yearly Results Snapshot (Consolidated) - Sep'25",
    "rhs": [
      {
        "prefix": "Net Sales ",
        "suffix": " Growth in half year ended Sep 2025 is 12.99% vs 103.65% in Mar 2025",
        "dir": -1
      },
      {
        "prefix": "Consolidated Net Profit ",
        "suffix": " Growth in half year ended Sep 2025 is -9.92% vs 108.64% in Mar 2025",
        "dir": -1
      }
    ],
    "table": {
      "header": [
        "Sep'25",
        "Mar'25",
        "Change(%)"
      ],
      "body": [
        {
          "field": "Net Sales",
          "val1": "241.10",
          "val2": "213.38",
          "chgp": "12.99%",
          "chgp_class": "positive"
        },
        {
          "field": "Operating Profit (PBDIT) excl Other Income",
          "val1": "34.01",
          "val2": "33.40",
          "chgp": "1.83%",
          "chgp_class": "positive"
        },
        {
          "field": "Interest",
          "val1": "6.57",
          "val2": "4.81",
          "chgp": "36.59%",
          "chgp_class": "negative"
        },
        {
          "field": "Exceptional Items",
          "val1": "0.00",
          "val2": "0.00",
          "chgp": "",
          "chgp_class": "neutral"
        },
        {
          "field": "Consolidate Net Profit",
          "val1": "19.15",
          "val2": "21.26",
          "chgp": "-9.92%",
          "chgp_class": "negative"
        },
        {
          "field": "Operating Profit Margin (Excl OI)",
          "val1": "14.11%",
          "val2": "15.65%",
          "chgp": "-1.54%",
          "chgp_class": "negative"
        }
      ]
    }
  },
  {
    "link": "nine-monthly",
    "btn_text": "All Nine Monthly Results",
    "header": "Nine Monthly Results Snapshot (Consolidated) - Jun'26",
    "rhs": [
      {
        "prefix": "Net Sales ",
        "suffix": "YoY Growth in nine months ended Jun 2026 is 95.99% vs 13.93% in Jun 2026",
        "dir": 1
      },
      {
        "prefix": "Consolidated Net Profit ",
        "suffix": "YoY Growth in nine months ended Jun 2026 is 72.96% vs 20.99% in Jun 2026",
        "dir": 1
      }
    ],
    "table": {
      "header": [
        "Jun'26",
        "Jun'26",
        "Change(%)"
      ],
      "body": [
        {
          "field": "Net Sales",
          "val1": "278.34",
          "val2": "142.02",
          "chgp": "95.99%",
          "chgp_class": "positive"
        },
        {
          "field": "Operating Profit (PBDIT) excl Other Income",
          "val1": "41.76",
          "val2": "27.59",
          "chgp": "51.36%",
          "chgp_class": "positive"
        },
        {
          "field": "Interest",
          "val1": "10.68",
          "val2": "8.02",
          "chgp": "33.17%",
          "chgp_class": "negative"
        },
        {
          "field": "Exceptional Items",
          "val1": "0.00",
          "val2": "0.00",
          "chgp": "",
          "chgp_class": "neutral"
        },
        {
          "field": "Consolidate Net Profit",
          "val1": "21.24",
          "val2": "12.28",
          "chgp": "72.96%",
          "chgp_class": "positive"
        },
        {
          "field": "Operating Profit Margin (Excl OI)",
          "val1": "15.00%",
          "val2": "19.43%",
          "chgp": "-4.43%",
          "chgp_class": "negative"
        }
      ]
    }
  },
  {
    "link": "annual",
    "btn_text": "All Annual Results",
    "header": "Annual Results Snapshot (Consolidated) - Mar'26",
    "rhs": [
      {
        "prefix": "Net Sales ",
        "suffix": "YoY Growth in year ended Mar 2026 is 26.22% vs 84.30% in Mar 2025",
        "dir": -1
      },
      {
        "prefix": "Consolidated Net Profit ",
        "suffix": "YoY Growth in year ended Mar 2026 is -28.43% vs 111.22% in Mar 2025",
        "dir": -1
      }
    ],
    "table": {
      "header": [
        "Mar'26",
        "Mar'25",
        "Change(%)"
      ],
      "body": [
        {
          "field": "Net Sales",
          "val1": "401.59",
          "val2": "318.16",
          "chgp": "26.22%",
          "chgp_class": "positive"
        },
        {
          "field": "Operating Profit (PBDIT) excl Other Income",
          "val1": "47.07",
          "val2": "53.22",
          "chgp": "-11.56%",
          "chgp_class": "negative"
        },
        {
          "field": "Interest",
          "val1": "13.85",
          "val2": "8.72",
          "chgp": "58.83%",
          "chgp_class": "negative"
        },
        {
          "field": "Exceptional Items",
          "val1": "0.00",
          "val2": "0.00",
          "chgp": "",
          "chgp_class": "neutral"
        },
        {
          "field": "Consolidate Net Profit",
          "val1": "22.51",
          "val2": "31.45",
          "chgp": "-28.43%",
          "chgp_class": "negative"
        },
        {
          "field": "Operating Profit Margin (Excl OI)",
          "val1": "11.72%",
          "val2": "16.73%",
          "chgp": "-5.01%",
          "chgp_class": "negative"
        }
      ]
    }
  }
]

Quarterly Results Snapshot (Standalone) - Jun'26 - YoYstock-summary

Jun'26
Jun'25
Change(%)
Net Sales
31.85
75.88
-58.03%
Operating Profit (PBDIT) excl Other Income
6.29
6.81
-7.64%
Interest
4.04
2.72
48.53%
Exceptional Items
0.00
0.00
Standalone Net Profit
1.15
2.53
-54.55%
Operating Profit Margin (Excl OI)
19.75%
8.97%
10.78%
Values in Rs Cr.
Net Sales

Not Applicable: The company has declared_date for only one period

Standalone Net Profit

Not Applicable: The company has declared_date for only one period

Half Yearly Results Snapshot (Consolidated) - Sep'25stock-summary

Sep'25
Mar'25
Change(%)
Net Sales
241.10
213.38
12.99%
Operating Profit (PBDIT) excl Other Income
34.01
33.40
1.83%
Interest
6.57
4.81
36.59%
Exceptional Items
0.00
0.00
Consolidate Net Profit
19.15
21.26
-9.92%
Operating Profit Margin (Excl OI)
14.11%
15.65%
-1.54%
Values in Rs Cr.
Direction Arrows
Net Sales

Growth in half year ended Sep 2025 is 12.99% vs 103.65% in Mar 2025

Direction Arrows
Consolidated Net Profit

Growth in half year ended Sep 2025 is -9.92% vs 108.64% in Mar 2025

Nine Monthly Results Snapshot (Consolidated) - Jun'26stock-summary

Jun'26
Jun'26
Change(%)
Net Sales
278.34
142.02
95.99%
Operating Profit (PBDIT) excl Other Income
41.76
27.59
51.36%
Interest
10.68
8.02
33.17%
Exceptional Items
0.00
0.00
Consolidate Net Profit
21.24
12.28
72.96%
Operating Profit Margin (Excl OI)
15.00%
19.43%
-4.43%
Values in Rs Cr.
Direction Arrows
Net Sales

YoY Growth in nine months ended Jun 2026 is 95.99% vs 13.93% in Jun 2026

Direction Arrows
Consolidated Net Profit

YoY Growth in nine months ended Jun 2026 is 72.96% vs 20.99% in Jun 2026

Annual Results Snapshot (Consolidated) - Mar'26stock-summary

Mar'26
Mar'25
Change(%)
Net Sales
401.59
318.16
26.22%
Operating Profit (PBDIT) excl Other Income
47.07
53.22
-11.56%
Interest
13.85
8.72
58.83%
Exceptional Items
0.00
0.00
Consolidate Net Profit
22.51
31.45
-28.43%
Operating Profit Margin (Excl OI)
11.72%
16.73%
-5.01%
Values in Rs Cr.
Direction Arrows
Net Sales

YoY Growth in year ended Mar 2026 is 26.22% vs 84.30% in Mar 2025

Direction Arrows
Consolidated Net Profit

YoY Growth in year ended Mar 2026 is -28.43% vs 111.22% in Mar 2025

stock-summaryCompany CV
About RMC Switchgears Ltd stock-summary
stock-summary
RMC Switchgears Ltd
Micro Cap
Other Electrical Equipment
RMC Switchgears Limited was originally incorporated in Rajasthan as "RFH Metal Castings Private Limited" on August 23, 1994, with Registrar of Companies. Subsequently the Company was converted into a Public Limited Company and the name of the Company was changed to "RFH Metal Castings Limited" vide a fresh Certificate of Incorporation dated December 29, 2008 issued by the Registrar of Companies.
Company Coordinates stock-summary
Company Details
7 KM From Chaksu KhotkawdaRoad, Tehsil Chaksu Tonk Road Jaipur Rajasthan : 303901
stock-summary
Tel: 91-141-4031516/4400222
stock-summary
info@rmcindia.in
Registrar Details
Link Intime India Pvt Ltd, C-13 Pannalal Silk Compound, L B S Marg, Bhandup , Mumbai