
Compare RNFI Services with Similar Stocks
Dashboard
Despite the size of the company, domestic mutual funds hold only 0% of the company
- Domestic mutual funds have capability to do in-depth on-the-ground research on companies- their small stake may signify either they are not comfortable at the price or the business
Below par performance in long term as well as near term
Stock DNA
Non Banking Financial Company (NBFC)
INR 606 Cr (Micro Cap)
22.00
20
0.00%
0.17
17.08%
3.57
Total Returns (Price + Dividend) 
RNFI Services for the last several years.
Risk Adjusted Returns v/s
Returns Beta

News

RNFI Services Ltd is Rated Sell
RNFI Services Ltd is rated 'Sell' by MarketsMOJO, with this rating last updated on 01 June 2026. However, the analysis and financial metrics discussed here reflect the stock's current position as of 12 June 2026, providing investors with the latest insights into its performance and outlook.
Read full news article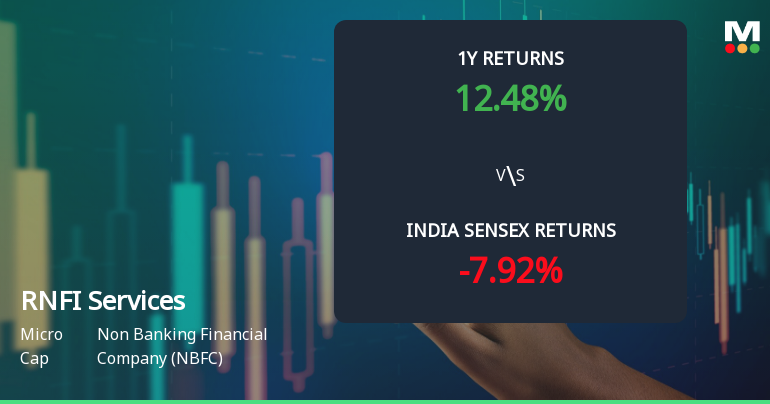
RNFI Services Ltd Technical Momentum Shifts Amid Bearish Signals
RNFI Services Ltd, a micro-cap player in the Non Banking Financial Company (NBFC) sector, has experienced a notable shift in its technical momentum, with key indicators signalling a bearish trend. The company’s current price stands at ₹258.75, down 0.60% from the previous close of ₹260.30, reflecting growing investor caution amid weakening technical signals and underperformance relative to benchmark indices.
Read full news article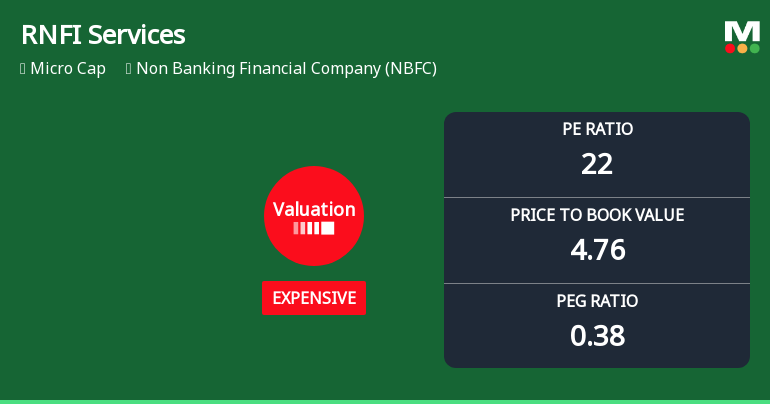
RNFI Services Ltd Valuation Shifts Amid Market Pressure
RNFI Services Ltd, a micro-cap player in the Non Banking Financial Company (NBFC) sector, has witnessed a notable shift in its valuation parameters, prompting a downgrade in its Mojo Grade from Hold to Sell. This article delves into the recent changes in its price-to-earnings (P/E) and price-to-book value (P/BV) ratios, compares these metrics with peer averages and historical benchmarks, and analyses the implications for investors amid a challenging market environment.
Read full news article Announcements
Corporate Actions

No Upcoming Board Meetings

No Dividend history available

No Splits history available

No Bonus history available

No Rights history available
Quality key factors
Valuation key factors
Technicals key factors
 Technical Indicator Scale: Bearish, Mildly Bearish, Sideways, Mildly Bullish, Bullish Turned
 Shareholding Snapshot : Mar 2026
Shareholding Compare (%holding)
Promoters
None
Held by 0 Schemes
Held by 0 FIIs
Deepankar Aggarwal (simran Singh Private Trust) (65.05%)
Saurabh Tripathi (2.83%)
24.88%
Quarterly Results Snapshot (Standalone) - Mar'26 - QoQ

QoQ Growth in quarter ended Mar 2026 is 5.48% vs 9.72% in Dec 2025
QoQ Growth in quarter ended Mar 2026 is -18.00% vs -3.61% in Dec 2025
Half Yearly Results Snapshot (Consolidated) - Sep'25

Growth in half year ended Sep 2025 is 2.78% vs 0.12% in Mar 2025
Growth in half year ended Sep 2025 is 32.62% vs 17.06% in Mar 2025
Nine Monthly Results Snapshot (Consolidated) - Dec'25
YoY Growth in nine months ended Dec 2025 is 3.83% vs -8.37% in Dec 2024
YoY Growth in nine months ended Dec 2025 is 56.86% vs 2.25% in Dec 2024
Annual Results Snapshot (Consolidated) - Mar'26
YoY Growth in year ended Mar 2026 is 5.64% vs -2.00% in Mar 2025
YoY Growth in year ended Mar 2026 is 59.32% vs 72.25% in Mar 2025
About RNFI Services Ltd

Company Coordinates


