
Dashboard
With a Negative Book Value, the company has a Weak Long Term Fundamental Strength
- Low ability to service debt as the company has a high Debt to EBITDA ratio of 4.48 times
- The company has been able to generate a Return on Capital Employed (avg) of 8.75% signifying low profitability per unit of total capital (equity and debt)
Negative results in Sep 25
Risky - Negative EBITDA
Stock DNA
Computers - Software & Consulting
INR 28 Cr (Micro Cap)
NA (Loss Making)
NA
0.00%
-1.02
0.27%
0.00
Total Returns (Price + Dividend) 
Latest dividend: 3 per share ex-dividend date: Sep-22-2015
Risk Adjusted Returns v/s
Returns Beta

News
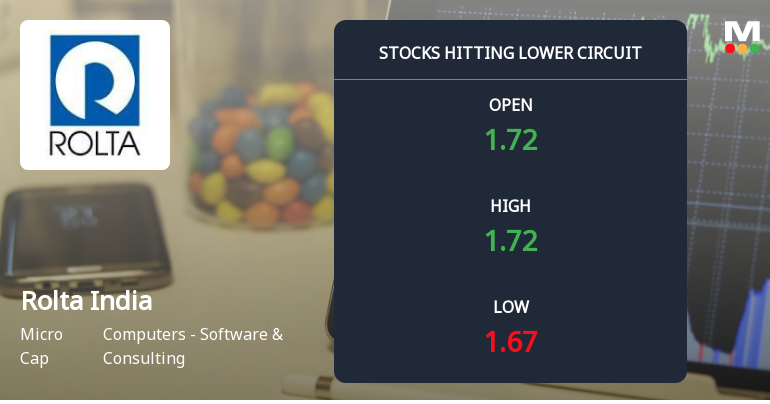
Rolta India Hits Lower Circuit Amid Heavy Selling Pressure and Market Weakness
Rolta India Ltd witnessed a sharp decline on 16 Dec 2025, hitting its lower circuit limit as intense selling pressure gripped the stock. The shares closed at a new 52-week low of ₹1.64, reflecting a maximum daily loss of 2.91%, significantly underperforming its sector and the broader market indices.
Read More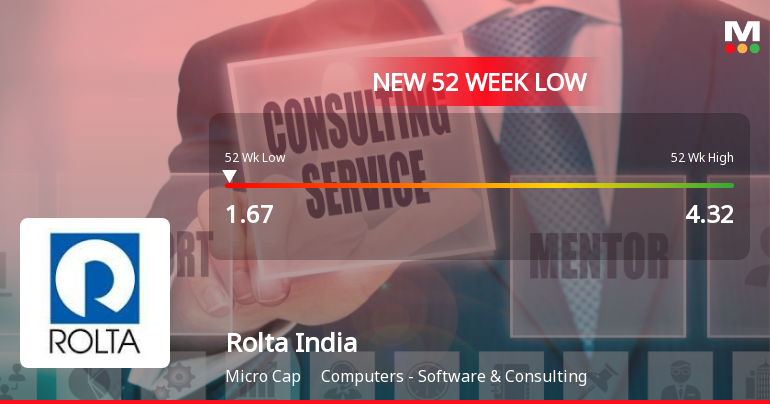
Rolta India Stock Falls to 52-Week Low of Rs.1.67 Amidst Continued Downtrend
Rolta India has reached a new 52-week low of Rs.1.67, marking a significant decline in its stock price amid ongoing downward momentum. The stock has underperformed its sector and broader market indices, reflecting persistent challenges in its financial and operational metrics.
Read More
Rolta India Hits Upper Circuit Amid Strong Buying Pressure and Market Interest
Rolta India Ltd witnessed a significant surge in trading activity on 12 Dec 2025, hitting its upper circuit limit of 4.14% gain and closing at ₹1.76. The stock outperformed its sector and broader market indices, reflecting robust buying interest and a notable demand-supply imbalance that led to a regulatory freeze on further trading.
Read More Announcements
Corporate Insolvency Resolution Process (CIRP)-Updates - Corporate Insolvency Resolution Process (CIRP)
19-Dec-2025 | Source : BSEAs per the attachment.
Corporate Insolvency Resolution Process (CIRP)-Approval of Resolution plan by Tribunal
16-Dec-2025 | Source : BSEAs per the attachment.
Corporate Insolvency Resolution Process (CIRP)-Approval of Resolution plan by Tribunal
15-Dec-2025 | Source : BSEAs per the attachment.
Corporate Actions

No Upcoming Board Meetings

Rolta India Ltd has declared 30% dividend, ex-date: 22 Sep 15

No Splits history available

Rolta India Ltd has announced 1:1 bonus issue, ex-date: 24 Jan 08

No Rights history available
Quality key factors
Valuation key factors
Technicals key factors
 Technical Indicator Scale: Bearish, Mildly Bearish, Sideways, Mildly Bullish, Bullish Turned
 Shareholding Snapshot : Sep 2025
Shareholding Compare (%holding)
Non Institution
None
Held by 3 Schemes (0.0%)
Held by 1 FIIs (0.0%)
Kamal K Singh (0.52%)
Central Bank Of India (1.88%)
87.86%
Quarterly Results Snapshot (Consolidated) - Sep'25 - QoQ
QoQ Growth in quarter ended Sep 2025 is 0.00% vs 0.00% in Jun 2025

QoQ Growth in quarter ended Sep 2025 is -30.92% vs -18.39% in Jun 2025
Half Yearly Results Snapshot (Consolidated) - Sep'25
Growth in half year ended Sep 2025 is 0.00% vs 0.00% in Sep 2024
Growth in half year ended Sep 2025 is -14.85% vs 17.36% in Sep 2024
Nine Monthly Results Snapshot (Consolidated) - Dec'24

YoY Growth in nine months ended Dec 2024 is 0.00% vs -100.00% in Dec 2023
YoY Growth in nine months ended Dec 2024 is 11.19% vs 97.27% in Dec 2023
Annual Results Snapshot (Consolidated) - Mar'25
YoY Growth in year ended Mar 2025 is 0.00% vs -100.00% in Mar 2024
YoY Growth in year ended Mar 2025 is 97.44% vs -14.33% in Mar 2024
About Rolta India Ltd

Company Coordinates


