Roto Pumps

  • Market Cap: Micro Cap
  • Industry: Compressors, Pumps & Diesel Engines
  • ISIN: INE535D01037
  • NSEID: ROTO
  • BSEID: 517500
INR
64.80
-1.17 (-1.77%)
BSENSE

Sep 02, 03:30 PM

BSE+NSE Vol: 2.78 lacs

  • Price Points
  • Score
  • Mojo Parameters
  • Total Return
  • News and Corporate Actions
  • Key factors
  • Shareholding
  • Financials
  • CompanyCV
stock-summaryPrice Point
High/Low

1Day

52 Week

Valuation
Technical
Day's Volume

CASH

2.78 lacs (-26.27%) Volume

Shareholding (Jun 2026)

FII

0.19%

Held by 6 FIIs

DII

0.11%

Held by 0 DIIs

Promoter

66.80%

Why is Roto Pumps Ltd falling/rising?

03-Sep-2026

As of 02-Sep, Roto Pumps Ltd's stock price is at Rs 64.74, down 2.0%, underperforming its sector. Despite increased investor participation, the stock shows a downward trend with mixed moving average signals.

As of 02-Sep, Roto Pumps Ltd's stock price is falling, currently at Rs 64.74, which reflects a decrease of Rs 1.32 or 2.0%. This decline is evident in today's performance, where the stock underperformed its sector by 0.85%. Additionally, the stock reached an intraday low of Rs 63.95, marking a drop of 3.19% during the trading session.<BR><BR>Over the past week, Roto Pumps Ltd has seen a decrease of 1.63%, which is slightly worse than the Sensex's decline of 1.17%. The one-month performance shows a more significant drop of 4.23%, compared to the Sensex's 1.95% decline. Year-to-date, the stock is down 6.16%, while the Sensex has fallen by 10.15%, indicating that Roto Pumps Ltd has been relatively resilient but still in a downward trend.<BR><BR>Despite the current decline, there has been a notable increase in investor participation, with a delivery volume of 3.6 lacs on September 1, which is up by 268.42% compared to the five-day average. However, the stock's moving averages indicate mixed signals; it is higher than the 5-day, 100-day, and 200-day moving averages but lower than the 20-day and 50-day moving averages, suggesting some volatility in its price trend.<BR><BR>Overall, the combination of recent price declines, underperformance relative to the sector, and mixed moving average signals contribute to the current downward movement of Roto Pumps Ltd's stock price.

View full answer

Who are in the management team of Roto Pumps?

01-Sep-2026

The management team of Roto Pumps includes Harish Chandra Gupta (Chairman & Managing Director), Anurag Gupta and Arvind Veer Gupta (Deputy Managing Directors), along with several non-executive and independent directors. They are responsible for the company's strategic direction and governance.

The management team of Roto Pumps includes the following key members:<BR><BR>1. **Harish Chandra Gupta** - Chairman & Managing Director<BR>2. **Anurag Gupta** - Deputy Managing Director<BR>3. **Arvind Veer Gupta** - Deputy Managing Director<BR>4. **Asha Gupta** - Non-Executive & Non-Independent Director<BR>5. **Ashwani K Verma** - Company Secretary & Compliance Officer<BR>6. **Ramesh Chandra Vaish** - Non-Executive & Independent Director<BR>7. **Anand Bordia** - Non-Executive & Independent Director<BR>8. **Basant Seth** - Non-Executive & Independent Director<BR>9. **Akhil Joshi** - Non-Executive & Independent Director<BR><BR>This team plays a crucial role in the strategic direction and governance of the company.

View full answer

What does Roto Pumps do?

01-Sep-2026

Roto Pumps Ltd designs and manufactures products in the compressors, pumps, and diesel engines sector, operating as a micro-cap company with a market cap of INR 1,192 Cr. As of June 2026, it reported net sales of 76 Cr and a net profit of 9 Cr.

Overview: <BR>Roto Pumps Ltd specializes in designing and manufacturing superior products and technologies in the Compressors, Pumps & Diesel Engines industry and operates within the Micro Cap market-cap bracket.<BR><BR>History: <BR>Roto Pumps Ltd was incorporated in July 1975 and underwent several status changes, including becoming a Public Limited Company in December 1993. The latest quarterly results reported net sales and net profit for June 2026.<BR><BR>Financial Snapshot: <BR>Net Sales: 76 Cr (Quarterly Results - Jun 2026) <BR>Net Profit: 9 Cr (Quarterly Results - Jun 2026) <BR>Market Cap: INR 1,192 Cr (Micro Cap)<BR><BR>Key Metrics: <BR>P/E: 43.00 <BR>Industry P/E: 34 <BR>Dividend Yield: 0.00% <BR>Debt-Equity: 0.04 <BR>Return on Equity: 10.31% <BR>Price to Book: 5.02<BR><BR>Contact Details: <BR>Address: Roto House, Noida Special Economic Zone Noida Uttar Pradesh : 201305 <BR>Tel: 91-120-2567902-04 <BR>Email: corp@rotopumps.com <BR>Website: http://www.rotopumps.com

View full answer

Who are the peers of the Roto Pumps?

01-Sep-2026

Roto Pumps' peers include Shakti Pumps, Greaves Cotton, Swaraj Engines, Oswal Pumps, Yuken India, Latteys Industri, Maks Energy, and Bright Solar. Roto Pumps has average management risk and growth, with a 1-year return of -25.32%, better than Oswal Pumps but worse than Greaves Cotton.

Peers: The peers of Roto Pumps are Shakti Pumps, Greaves Cotton, Swaraj Engines, Oswal Pumps, Yuken India, Latteys Industri, Maks Energy, and Bright Solar.<BR><BR>Quality Snapshot: Excellent management risk is observed at Shakti Pumps, Swaraj Engines, and Oswal Pumps, while Average management risk is found at Greaves Cotton, Yuken India, Roto Pumps, and Latteys Industri. Below Average management risk is noted at Maks Energy and Bright Solar. Growth is Average at Shakti Pumps and Roto Pumps, Below Average at Swaraj Engines and Yuken India, while Excellent growth is seen at Oswal Pumps and Latteys Industri. Maks Energy and Bright Solar exhibit Good growth. Capital Structure is Excellent at Shakti Pumps, Swaraj Engines, and Roto Pumps, Good at Greaves Cotton, Average at Yuken India, and Below Average at Latteys Industri, Maks Energy, and Bright Solar.<BR><BR>Return Snapshot: The peer with the highest 1-year return is Greaves Cotton at -0.10%, while the lowest is Oswal Pumps at -63.09%. Roto Pumps has a 1-year return of -25.32%, which is better than Oswal Pumps but worse than Greaves Cotton. Additionally, Shakti Pumps, Oswal Pumps, Maks Energy, and Bright Solar have negative six-month returns.

View full answer

How big is Roto Pumps?

01-Sep-2026

As of 31st August, Roto Pumps Ltd has a market capitalization of 1,192.00 Cr, with recent net sales of 294.36 Cr and a net profit of 27.72 Cr. Shareholder's funds are 220.81 Cr, and total assets amount to 317.68 Cr as of March 2025.

As of 31st August, Roto Pumps Ltd has a market capitalization of 1,192.00 Cr, categorizing it as a Micro Cap company.<BR><BR>In the latest four quarters, Roto Pumps reported Net Sales of 294.36 Cr and a Net Profit of 27.72 Cr.<BR><BR>The latest annual period for the balance sheet is March 2025, with Shareholder's Funds amounting to 220.81 Cr and Total Assets of 317.68 Cr.

View full answer

Should I buy, sell or hold Roto Pumps Ltd?

25-Aug-2026

Are Roto Pumps Ltd latest results good or bad?

08-Aug-2026

Roto Pumps Ltd's latest results are concerning, with a 2.92% increase in net sales to ₹81.30 crores, but a sharp 55.48% decline in net profit to ₹5.73 crores and a significant drop in operating margins, indicating operational inefficiencies and rising costs. Overall, the financial performance suggests challenges that need to be addressed for sustainable profitability.

Roto Pumps Ltd's latest results indicate a challenging situation for the company. While net sales increased by 2.92% year-on-year to ₹81.30 crores, the significant decline in profitability is concerning. The net profit fell sharply by 55.48% to ₹5.73 crores, and operating margins contracted dramatically from 25.65% to 15.73%, reflecting a 990 basis points erosion in operational efficiency.<BR><BR>This divergence between revenue growth and profit decline raises questions about the company's competitive positioning and operational effectiveness. Additionally, the effective tax rate increased significantly, further compressing profitability. Although there was a sequential revenue growth of 11.83% compared to the previous quarter, the overall financial performance suggests that Roto Pumps is facing structural challenges, including rising costs and competitive pressures.<BR><BR>Overall, the results can be characterized as bad, highlighting the need for management to address these operational inefficiencies and margin pressures to ensure sustainable profitability moving forward.

View full answer

When is the next results date for Roto Pumps Ltd?

04-Aug-2026

The next results date for Roto Pumps Ltd is 08 August 2026.

The next results date for Roto Pumps Ltd is scheduled for 08 August 2026.

View full answer

Is Roto Pumps overvalued or undervalued?

27-Nov-2025

As of November 26, 2025, Roto Pumps is considered very expensive with a PE ratio of 39.71, indicating significant overvaluation compared to peers, and despite a recent 6.02% weekly return, it has declined 35.05% year-to-date against the Sensex's 9.56% gain.

As of 26 November 2025, Roto Pumps' valuation grade has moved from expensive to very expensive, indicating a significant increase in perceived overvaluation. The company is currently deemed overvalued, with a PE ratio of 39.71, a Price to Book Value of 5.05, and an EV to EBITDA ratio of 20.53. These figures suggest that the stock is trading at a premium compared to its earnings and book value.<BR><BR>In comparison to its peers, Roto Pumps' PE ratio is slightly lower than Elgi Equipments at 40.57 but higher than Kirl. Brothers at 34.31, which further emphasizes its overvaluation in the market. Additionally, while Roto Pumps has a PEG ratio of 0.00, indicating no growth expectations, other peers like Ingersoll-Rand and KSB are also categorized as very expensive, with PE ratios of 45.36 and 49.18, respectively. Despite recent stock performance showing a 6.02% return over the past week, the longer-term trends reveal a decline, with a year-to-date drop of 35.05%, contrasting with the Sensex's 9.56% gain.

View full answer

How has been the historical performance of Roto Pumps?

26-Nov-2025

Roto Pumps has shown consistent growth in net sales, increasing from 126.53 Cr in Mar'21 to 293.87 Cr in Mar'25, despite some fluctuations in profitability metrics. Total assets grew significantly, reaching 317.68 Cr in Mar'25, indicating a robust overall performance.

Answer:<BR>The historical performance of Roto Pumps shows a consistent growth trend in net sales and profits over the years.<BR><BR>Breakdown:<BR>Roto Pumps has demonstrated significant growth in net sales, increasing from 126.53 Cr in Mar'21 to 293.87 Cr in Mar'25. This upward trend is reflected in total operating income, which rose from 126.53 Cr in Mar'21 to 293.87 Cr in Mar'25. The company's total expenditure also increased, from 99.60 Cr in Mar'21 to 230.91 Cr in Mar'25, impacting operating profit, which peaked at 66.59 Cr in Mar'25, although it was slightly lower than the previous year’s 70.01 Cr. Profit before tax showed fluctuations, reaching 43.96 Cr in Mar'25, down from 52.93 Cr in Mar'24, while profit after tax was 33.64 Cr in Mar'25, compared to 39.42 Cr in Mar'24. The company's total assets grew from 126.82 Cr in Mar'20 to 317.68 Cr in Mar'25, with total liabilities also increasing from 126.82 Cr to 301.18 Cr during the same period. Cash flow from operating activities improved to 36.00 Cr in Mar'25, although the net cash outflow was -2.00 Cr. Overall, Roto Pumps has shown a robust growth trajectory in sales and profits, despite some fluctuations in profitability metrics.

View full answer

Is Roto Pumps technically bullish or bearish?

29-Sep-2025

As of September 26, 2025, Roto Pumps is in a bearish trend with moderate strength, indicated by bearish MACD, Bollinger Bands, and moving averages, alongside mildly bearish signals from KST and Dow Theory.

As of 26 September 2025, the technical trend has changed from mildly bearish to bearish. The current stance is bearish with a moderate strength. Key indicators driving this include a bearish MACD on the weekly timeframe, bearish Bollinger Bands on both weekly and monthly timeframes, and bearish moving averages on the daily chart. Additionally, the KST and Dow Theory both indicate mildly bearish conditions on weekly and monthly timeframes, while the OBV also reflects a mildly bearish sentiment. Overall, Roto Pumps is facing significant downward pressure in the current market environment.

View full answer

Who are the top shareholders of the Roto Pumps?

17-Jul-2025

The top shareholders of Roto Pumps include promoter Asha Gupta with 15.92% ownership, individual investors holding 27.05%, and various institutional investors, including two mutual funds and nine foreign institutional investors. The highest public shareholder is Amit Gupta at 1.15%, with no pledged promoter holdings reported.

The top shareholders of Roto Pumps include the promoters, who are the majority shareholders. Asha Gupta is the promoter with the highest holding, owning 15.92% of the company. Additionally, individual investors collectively hold 27.05% of the shares. In terms of institutional investors, there are two mutual fund schemes that hold 1.0% and nine foreign institutional investors (FIIs) that hold 0.14%. The highest public shareholder is Amit Gupta, who owns 1.15%. There are no pledged promoter holdings reported.

View full answer

What is the bonus history of the Roto Pumps?

06-Jun-2025

Roto Pumps announced a 1:1 bonus issue on July 7, 2023, with a record date of July 8, 2023, meaning shareholders received one additional share for each share owned.

Roto Pumps has a recent bonus history that includes a 1:1 bonus issue announced with an ex-date of July 7, 2023. The record date for this bonus was July 8, 2023. This means that shareholders on record as of that date received an additional share for each share they owned. If you have any more questions about Roto Pumps or need further details, feel free to ask!

View full answer

Has Roto Pumps declared dividend?

06-Jun-2025

Roto Pumps Ltd has declared a 94% dividend, amounting to ₹1.88 per share, with an ex-date of September 20, 2024. While the company has shown significant price appreciation over the years, it has not provided dividend returns in the past periods.

Roto Pumps Ltd has declared a 94% dividend.<BR><BR>Dividend Details:<BR>- Percentage announced: 94%<BR>- Amount per share: 1.88<BR>- Ex-date: 20 Sep 24<BR><BR>Dividend Yield: 0.36%.<BR><BR>Total Returns by Period:<BR>In the last 6 months, the price return was -5.98%, with a dividend return of 0%, resulting in a total return of -5.98%.<BR><BR>Over the past year, the price return was 25.52%, with a dividend return of 0%, leading to a total return of 25.52%.<BR><BR>In the 2-year period, the price return was 49.89%, with a dividend return of 0%, resulting in a total return of 49.89%.<BR><BR>For the 3-year period, the price return was 119.03%, with a dividend return of 0%, leading to a total return of 119.03%.<BR><BR>In the 4-year period, the price return was 381.38%, with a dividend return of 0%, resulting in a total return of 381.38%.<BR><BR>Over the last 5 years, the price return was 989.64%, with a dividend return of 0%, leading to a total return of 989.64%.<BR><BR>Overall, Roto Pumps has declared a significant dividend, but the total returns over various periods show that while the price has increased substantially, the dividend returns have been consistently zero in the past periods, indicating a focus on capital appreciation rather than income distribution.

View full answer
iScoreScore
Click here to find our call on this stock
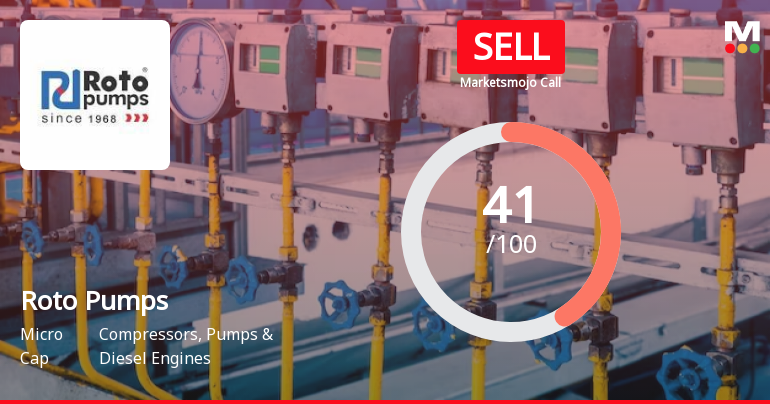
Strong Sell
Sell
Hold
Buy
Strong Buy

Dashboard

1

Poor long term growth as Operating profit has grown by an annual rate 5.68% of over the last 5 years

 
2

Flat results in Jun 26

3

With ROE of 10.3, it has a Very Expensive valuation with a 5.1 Price to Book Value

4

Despite the size of the company, domestic mutual funds hold only 0% of the company

5

Underperformed the market in the last 1 year

stock-summaryMojo Parameters

Mojo Parameters

Loading Valuation Snapshot...

Stock DNA

stock-summary
Industry

Compressors, Pumps & Diesel Engines

stock-summary
Market cap

INR 1,221 Cr (Micro Cap)

stock-summary
P/E

44.00

stock-summary
Industry P/E

34

stock-summary
Dividend Yield

0.00%

stock-summary
Debt Equity

0.04

stock-summary
Return on Equity

10.31%

stock-summary
Price to Book

5.19

Revenue and Profits:
Net Sales:
76 Cr
(Quarterly Results - Jun 2026)
Net Profit:
9 Cr
stock-summaryTotal Returns
Total Returns (Price + Dividend) stock-summary
Dividend Yield (0%)
TimePeriod
Price Return
Dividend Return
Total Return
3 Months
15.67%
0%
15.67%
6 Months
15.9%
0%
15.9%
1 Year
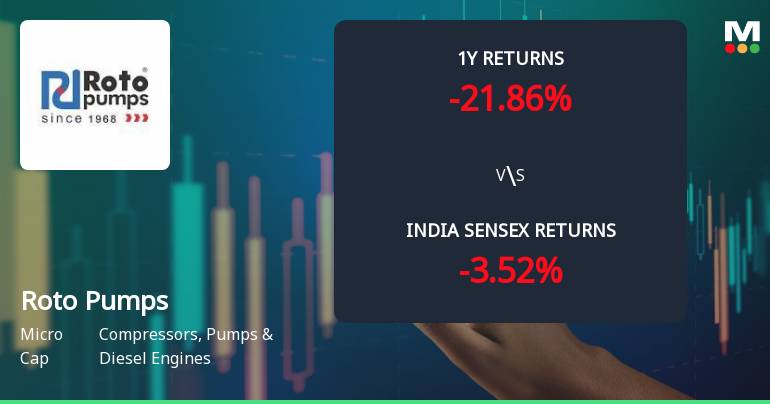
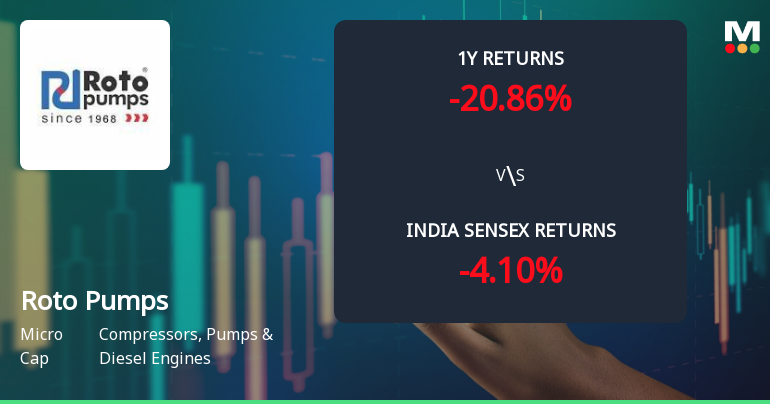
-21.59%
0%
-21.59%
2 Years
-31.16%
1.18%
-29.98%
3 Years
10.81%
1.88%
12.69%
4 Years
69.41%
4.48%
73.89%
5 Years
0%
0%
0.0%

Latest dividend: 0.8 per share ex-dividend date: Jul-11-2025

Risk Adjusted Returns v/s stock-summary
Returns Beta
Icon
Beta has not been calculated since enough price history is not available
stock-summaryNews & Corporate Actions

Announcements stock-summary

Icon
No announcement available

Corporate Actions stock-summary

stock-summary
BOARD MEETING

No Upcoming Board Meetings

stock-summary
DIVIDEND

Roto Pumps Ltd has declared 80% dividend, ex-date: 11 Jul 25

stock-summary
SPLITS

Roto Pumps Ltd has announced 1:2 stock split, ex-date: 08 Nov 24

stock-summary
BONUS

Roto Pumps Ltd has announced 2:1 bonus issue, ex-date: 11 Jul 25

stock-summary
RIGHTS

No Rights history available

stock-summaryKey Factors

Quality key factors stock-summary

Factor
Value
Sales Growth (5y)
15.68%
EBIT Growth (5y)
5.68%
EBIT to Interest (avg)
13.51
Debt to EBITDA (avg)
0.68
Net Debt to Equity (avg)
0.04
Sales to Capital Employed (avg)
1.10
Tax Ratio
27.78%
Dividend Payout Ratio
15.06%
Pledged Shares
0
Institutional Holding
0.30%
ROCE (avg)
23.03%
ROE (avg)
17.70%

Valuation key factors

Factor
Value
P/E Ratio
44
Industry P/E
34
Price to Book Value
5.08
EV to EBIT
33.14
EV to EBITDA
23.09
EV to Capital Employed
4.93
EV to Sales
4.17
PEG Ratio
NA
Dividend Yield
NA
ROCE (Latest)
14.06%
ROE (Latest)
10.31%

Technicals key factors

Indicator
Weekly
Monthly
MACD
Mildly Bearish
Bearish
RSI
No Signal
No Signal
Bollinger Bands
Bullish
Mildly Bearish
Moving Averages
Mildly Bullish (Daily)
KST
Mildly Bearish
Bearish
Dow Theory
Mildly Bearish
Mildly Bearish
OBV
Mildly Bearish
No Trend
stock-summary Technical Indicator Scale: Bearish, Mildly Bearish, Sideways, Mildly Bullish, Bullish  Turned 
stock-summaryShareholding
Shareholding Snapshot : Jun 2026stock-summary
Shareholding Compare (%holding) stock-summary
Majority shareholders

Promoters

Pledged Promoter Holdings

None

Mutual Funds

Held by 0 Schemes

FIIs

Held by 6 FIIs (0.19%)

Promoter with highest holding

Asha Gupta (15.92%)

Highest Public shareholder

Investor Education And Protection Fund Authority (1.45%)

Individual Investors Holdings

26.04%

stock-summaryFinancial
[
  {
    "link": "quarterly",
    "btn_text": "All Quarterly Results",
    "header": "Quarterly Results Snapshot (Consolidated) - Jun'26 - YoY",
    "rhs": [
      {
        "prefix": "Net Sales ",
        "suffix": "YoY Growth in quarter ended Jun 2026 is 14.75% vs 14.36% in Jun 2025",
        "dir": 1
      },
      {
        "prefix": "Consolidated Net Profit ",
        "suffix": "YoY Growth in quarter ended Jun 2026 is 46.83% vs 13.72% in Jun 2025",
        "dir": 1
      }
    ],
    "table": {
      "header": [
        "Jun'26",
        "Jun'25",
        "Change(%)"
      ],
      "body": [
        {
          "field": "Net Sales",
          "val1": "75.60",
          "val2": "65.88",
          "chgp": "14.75%",
          "chgp_class": "positive"
        },
        {
          "field": "Operating Profit (PBDIT) excl Other Income",
          "val1": "15.19",
          "val2": "13.58",
          "chgp": "11.86%",
          "chgp_class": "positive"
        },
        {
          "field": "Interest",
          "val1": "0.80",
          "val2": "0.94",
          "chgp": "-14.89%",
          "chgp_class": "positive"
        },
        {
          "field": "Exceptional Items",
          "val1": "0.00",
          "val2": "0.00",
          "chgp": "",
          "chgp_class": "neutral"
        },
        {
          "field": "Consolidate Net Profit",
          "val1": "9.25",
          "val2": "6.30",
          "chgp": "46.83%",
          "chgp_class": "positive"
        },
        {
          "field": "Operating Profit Margin (Excl OI)",
          "val1": "20.09%",
          "val2": "20.61%",
          "chgp": "-0.52%",
          "chgp_class": "negative"
        }
      ]
    }
  },
  {
    "link": "half-yearly",
    "btn_text": "All Half Yearly Results",
    "header": "Half Yearly Results Snapshot (Consolidated) - Sep'25",
    "rhs": [
      {
        "prefix": "Net Sales ",
        "suffix": " Growth in half year ended Sep 2025 is -8.12% vs 4.61% in Sep 2024",
        "dir": -1
      },
      {
        "prefix": "Consolidated Net Profit ",
        "suffix": " Growth in half year ended Sep 2025 is -27.77% vs -16.33% in Sep 2024",
        "dir": -1
      }
    ],
    "table": {
      "header": [
        "Sep'25",
        "Sep'24",
        "Change(%)"
      ],
      "body": [
        {
          "field": "Net Sales",
          "val1": "130.65",
          "val2": "142.20",
          "chgp": "-8.12%",
          "chgp_class": "negative"
        },
        {
          "field": "Operating Profit (PBDIT) excl Other Income",
          "val1": "25.25",
          "val2": "31.46",
          "chgp": "-19.74%",
          "chgp_class": "negative"
        },
        {
          "field": "Interest",
          "val1": "1.66",
          "val2": "1.84",
          "chgp": "-9.78%",
          "chgp_class": "positive"
        },
        {
          "field": "Exceptional Items",
          "val1": "0.00",
          "val2": "0.00",
          "chgp": "",
          "chgp_class": "neutral"
        },
        {
          "field": "Consolidate Net Profit",
          "val1": "12.25",
          "val2": "16.96",
          "chgp": "-27.77%",
          "chgp_class": "negative"
        },
        {
          "field": "Operating Profit Margin (Excl OI)",
          "val1": "19.33%",
          "val2": "22.12%",
          "chgp": "-2.79%",
          "chgp_class": "negative"
        }
      ]
    }
  },
  {
    "link": "nine-monthly",
    "btn_text": "All Nine Monthly Results",
    "header": "Nine Monthly Results Snapshot (Consolidated) - Dec'25",
    "rhs": [
      {
        "prefix": "Net Sales ",
        "suffix": "YoY Growth in nine months ended Dec 2025 is -5.37% vs 11.59% in Dec 2024",
        "dir": -1
      },
      {
        "prefix": "Consolidated Net Profit ",
        "suffix": "YoY Growth in nine months ended Dec 2025 is -9.03% vs -21.15% in Dec 2024",
        "dir": 1
      }
    ],
    "table": {
      "header": [
        "Dec'25",
        "Dec'24",
        "Change(%)"
      ],
      "body": [
        {
          "field": "Net Sales",
          "val1": "203.35",
          "val2": "214.89",
          "chgp": "-5.37%",
          "chgp_class": "negative"
        },
        {
          "field": "Operating Profit (PBDIT) excl Other Income",
          "val1": "38.82",
          "val2": "42.71",
          "chgp": "-9.11%",
          "chgp_class": "negative"
        },
        {
          "field": "Interest",
          "val1": "2.37",
          "val2": "2.88",
          "chgp": "-17.71%",
          "chgp_class": "positive"
        },
        {
          "field": "Exceptional Items",
          "val1": "0.00",
          "val2": "0.00",
          "chgp": "",
          "chgp_class": "neutral"
        },
        {
          "field": "Consolidate Net Profit",
          "val1": "19.03",
          "val2": "20.92",
          "chgp": "-9.03%",
          "chgp_class": "negative"
        },
        {
          "field": "Operating Profit Margin (Excl OI)",
          "val1": "19.09%",
          "val2": "19.88%",
          "chgp": "-0.79%",
          "chgp_class": "negative"
        }
      ]
    }
  },
  {
    "link": "annual",
    "btn_text": "All Annual Results",
    "header": "Annual Results Snapshot (Consolidated) - Mar'26",
    "rhs": [
      {
        "prefix": "Net Sales ",
        "suffix": "YoY Growth in year ended Mar 2026 is -3.14% vs 7.06% in Mar 2025",
        "dir": -1
      },
      {
        "prefix": "Consolidated Net Profit ",
        "suffix": "YoY Growth in year ended Mar 2026 is -26.75% vs -13.71% in Mar 2025",
        "dir": -1
      }
    ],
    "table": {
      "header": [
        "Mar'26",
        "Mar'25",
        "Change(%)"
      ],
      "body": [
        {
          "field": "Net Sales",
          "val1": "284.65",
          "val2": "293.87",
          "chgp": "-3.14%",
          "chgp_class": "negative"
        },
        {
          "field": "Operating Profit (PBDIT) excl Other Income",
          "val1": "51.60",
          "val2": "62.96",
          "chgp": "-18.04%",
          "chgp_class": "negative"
        },
        {
          "field": "Interest",
          "val1": "3.14",
          "val2": "4.09",
          "chgp": "-23.23%",
          "chgp_class": "positive"
        },
        {
          "field": "Exceptional Items",
          "val1": "0.00",
          "val2": "0.00",
          "chgp": "",
          "chgp_class": "neutral"
        },
        {
          "field": "Consolidate Net Profit",
          "val1": "24.76",
          "val2": "33.80",
          "chgp": "-26.75%",
          "chgp_class": "negative"
        },
        {
          "field": "Operating Profit Margin (Excl OI)",
          "val1": "18.13%",
          "val2": "21.42%",
          "chgp": "-3.29%",
          "chgp_class": "negative"
        }
      ]
    }
  }
]

Quarterly Results Snapshot (Consolidated) - Jun'26 - YoYstock-summary

Jun'26
Jun'25
Change(%)
Net Sales
75.60
65.88
14.75%
Operating Profit (PBDIT) excl Other Income
15.19
13.58
11.86%
Interest
0.80
0.94
-14.89%
Exceptional Items
0.00
0.00
Consolidate Net Profit
9.25
6.30
46.83%
Operating Profit Margin (Excl OI)
20.09%
20.61%
-0.52%
Values in Rs Cr.
Direction Arrows
Net Sales

YoY Growth in quarter ended Jun 2026 is 14.75% vs 14.36% in Jun 2025

Direction Arrows
Consolidated Net Profit

YoY Growth in quarter ended Jun 2026 is 46.83% vs 13.72% in Jun 2025

Half Yearly Results Snapshot (Consolidated) - Sep'25stock-summary

Sep'25
Sep'24
Change(%)
Net Sales
130.65
142.20
-8.12%
Operating Profit (PBDIT) excl Other Income
25.25
31.46
-19.74%
Interest
1.66
1.84
-9.78%
Exceptional Items
0.00
0.00
Consolidate Net Profit
12.25
16.96
-27.77%
Operating Profit Margin (Excl OI)
19.33%
22.12%
-2.79%
Values in Rs Cr.
Direction Arrows
Net Sales

Growth in half year ended Sep 2025 is -8.12% vs 4.61% in Sep 2024

Direction Arrows
Consolidated Net Profit

Growth in half year ended Sep 2025 is -27.77% vs -16.33% in Sep 2024

Nine Monthly Results Snapshot (Consolidated) - Dec'25stock-summary

Dec'25
Dec'24
Change(%)
Net Sales
203.35
214.89
-5.37%
Operating Profit (PBDIT) excl Other Income
38.82
42.71
-9.11%
Interest
2.37
2.88
-17.71%
Exceptional Items
0.00
0.00
Consolidate Net Profit
19.03
20.92
-9.03%
Operating Profit Margin (Excl OI)
19.09%
19.88%
-0.79%
Values in Rs Cr.
Direction Arrows
Net Sales

YoY Growth in nine months ended Dec 2025 is -5.37% vs 11.59% in Dec 2024

Direction Arrows
Consolidated Net Profit

YoY Growth in nine months ended Dec 2025 is -9.03% vs -21.15% in Dec 2024

Annual Results Snapshot (Consolidated) - Mar'26stock-summary

Mar'26
Mar'25
Change(%)
Net Sales
284.65
293.87
-3.14%
Operating Profit (PBDIT) excl Other Income
51.60
62.96
-18.04%
Interest
3.14
4.09
-23.23%
Exceptional Items
0.00
0.00
Consolidate Net Profit
24.76
33.80
-26.75%
Operating Profit Margin (Excl OI)
18.13%
21.42%
-3.29%
Values in Rs Cr.
Direction Arrows
Net Sales

YoY Growth in year ended Mar 2026 is -3.14% vs 7.06% in Mar 2025

Direction Arrows
Consolidated Net Profit

YoY Growth in year ended Mar 2026 is -26.75% vs -13.71% in Mar 2025

stock-summaryCompany CV
About Roto Pumps Ltd stock-summary
stock-summary
Roto Pumps Ltd
Micro Cap
Compressors, Pumps & Diesel Engines
Founded in 1968 by R R Gupta as a Partnership Firm, Roto Pumps Ltd (RPL) was incorporated as Roto Pumps & Hydraulics Pvt Ltd in Jul.'75 and converted into a Public Limited Company in Dec.'93. In Jul.'81, Roto Pumps Pvt Ltd, a Group Company, was amalgamated with Roto Pumps & Hydraulics Pvt Ltd. In Feb.'91, it was taken over by another Group Company, Dwarka Industrial Development (Chains) Pvt Ltd. The Company has a rich heritage of designing and manufacturing superior products and technologies.
Company Coordinates stock-summary
Company Details
Roto House, Noida Special Economic Zone Noida Uttar Pradesh : 201305
stock-summary
Tel: 91-120-2567902-04
stock-summary
corp@rotopumps.com
Registrar Details
RCMC Share Registry Pvt Ltd , B-106, Sector-2, Noida Noida Uttar Pradesh, Noida