
Compare Roto Pumps with Similar Stocks
Dashboard
Poor long term growth as Operating profit has grown by an annual rate 10.90% of over the last 5 years
Negative results in Mar 26
With ROE of 10.3, it has a Very Expensive valuation with a 5.1 Price to Book Value
Falling Participation by Institutional Investors
Underperformed the market in the last 1 year
Stock DNA
Compressors, Pumps & Diesel Engines
INR 1,143 Cr (Micro Cap)
49.00
32
1.37%
0.04
10.31%
4.57
Total Returns (Price + Dividend) 
Latest dividend: 0.8 per share ex-dividend date: Jul-11-2025
Risk Adjusted Returns v/s
Returns Beta

News

Roto Pumps Ltd is Rated Strong Sell
Roto Pumps Ltd is rated Strong Sell by MarketsMOJO, with this rating last updated on 29 May 2026. However, the analysis and financial metrics discussed here reflect the stock’s current position as of 11 June 2026, providing investors with the latest insights into the company’s performance and outlook.
Read full news article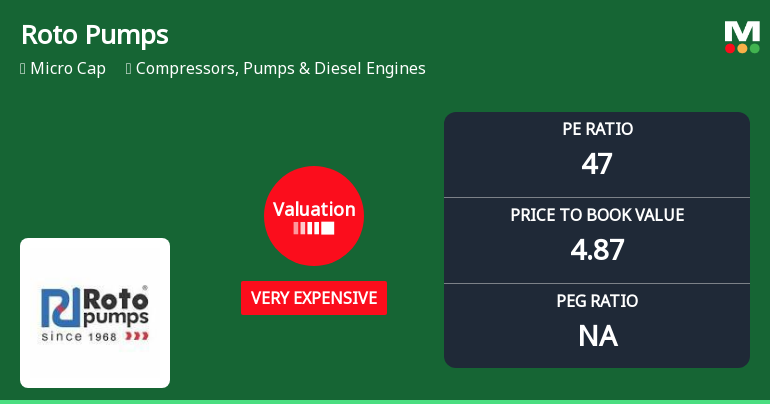
Roto Pumps Ltd Valuation Shifts Signal Heightened Price Risk Amid Strong Sell Rating
Roto Pumps Ltd, a micro-cap player in the Compressors, Pumps & Diesel Engines sector, has witnessed a significant shift in its valuation parameters, moving from expensive to very expensive territory. Despite a recent uptick in share price, the company’s elevated price-to-earnings (P/E) and price-to-book value (P/BV) ratios raise questions about its price attractiveness relative to historical averages and peer benchmarks.
Read full news article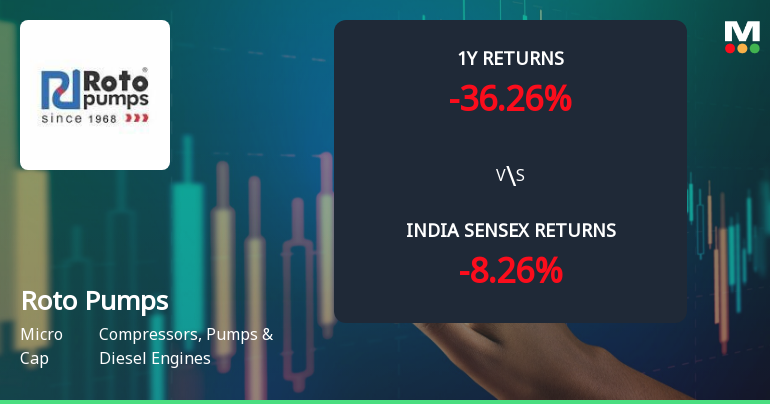
Roto Pumps Ltd Technical Momentum Shifts Amid Bearish Market Sentiment
Roto Pumps Ltd, a micro-cap player in the Compressors, Pumps & Diesel Engines sector, has experienced a nuanced shift in its technical momentum, moving from a bearish to a mildly bearish stance. Despite a modest day gain of 0.27%, the stock’s broader technical indicators reveal a complex interplay of bullish and bearish signals, underscoring the challenges faced by investors amid subdued price momentum and sector headwinds.
Read full news article Announcements
Announcement under Regulation 30 (LODR)-Newspaper Publication
29-May-2026 | Source : BSENewspaper publication of financial results
Update on board meeting
25-May-2026 | Source : BSEThe Board Meeting to be held on 26/05/2026 has been revised to 27/05/2026 The Board Meeting to be held on 26/05/2026 has been revised to 27/05/2026
Corporate Action-Board to consider Dividend
25-May-2026 | Source : BSEIntimatin of re-scheduling of the Board meeting to consider recommendation of the final dividend if any for the financial year ended 31.03.2026
Corporate Actions

No Upcoming Board Meetings

Roto Pumps Ltd has declared 80% dividend, ex-date: 11 Jul 25

Roto Pumps Ltd has announced 1:2 stock split, ex-date: 08 Nov 24

Roto Pumps Ltd has announced 2:1 bonus issue, ex-date: 11 Jul 25

No Rights history available
Quality key factors
Valuation key factors
Technicals key factors
 Technical Indicator Scale: Bearish, Mildly Bearish, Sideways, Mildly Bullish, Bullish Turned
 Shareholding Snapshot : Mar 2026
Shareholding Compare (%holding)
Promoters
None
Held by 1 Schemes (0.15%)
Held by 6 FIIs (0.14%)
Asha Gupta (15.92%)
Amit Gupta (1.11%)
25.98%
Quarterly Results Snapshot (Consolidated) - Mar'26 - YoY

YoY Growth in quarter ended Mar 2026 is 2.92% vs -3.59% in Mar 2025

YoY Growth in quarter ended Mar 2026 is -55.48% vs 1.82% in Mar 2025
Half Yearly Results Snapshot (Consolidated) - Sep'25
Growth in half year ended Sep 2025 is -8.12% vs 4.61% in Sep 2024
Growth in half year ended Sep 2025 is -27.77% vs -16.33% in Sep 2024
Nine Monthly Results Snapshot (Consolidated) - Dec'25
YoY Growth in nine months ended Dec 2025 is -5.37% vs 11.59% in Dec 2024
YoY Growth in nine months ended Dec 2025 is -9.03% vs -21.15% in Dec 2024
Annual Results Snapshot (Consolidated) - Mar'26
YoY Growth in year ended Mar 2026 is -3.14% vs 7.06% in Mar 2025
YoY Growth in year ended Mar 2026 is -26.75% vs -13.71% in Mar 2025
About Roto Pumps Ltd

Company Coordinates


