
Compare Royal India Corp with Similar Stocks
Stock DNA
Gems, Jewellery And Watches
INR 73 Cr (Micro Cap)
1.00
21
0.00%
-0.01
38.72%
0.54
Total Returns (Price + Dividend) 
Royal India Corp for the last several years.
Risk Adjusted Returns v/s
Returns Beta

News

Royal India Corporation Ltd is Rated Sell
Royal India Corporation Ltd is rated 'Sell' by MarketsMOJO, with this rating last updated on 07 April 2026. However, the analysis and financial metrics discussed here reflect the stock's current position as of 08 June 2026, providing investors with an up-to-date view of the company's fundamentals, valuation, financial trends, and technical outlook.
Read full news articleAre Royal India Corporation Ltd latest results good or bad?
Royal India Corporation Ltd's latest financial results for Q4 FY26 present a complex picture that raises significant concerns about the company's operational health. The reported net profit of ₹46.94 crores appears substantial, especially when compared to the previous year's net profit of ₹10.90 crores, indicating a year-on-year increase. However, this profit is primarily attributed to exceptional other income of ₹73.32 crores, which constituted 103.11% of profit before tax. This reliance on non-operational income casts doubt on the sustainability of the reported earnings. In stark contrast, the company's net sales for the quarter plummeted to ₹0.50 crores, a catastrophic decline of 99.29% year-on-year from ₹70.22 crores in Q4 FY25. This decline follows a troubling trend, with sales having effectively evaporated over recent quarters, highlighting a severe operational collapse rather than a temporary setbac...
Read full news article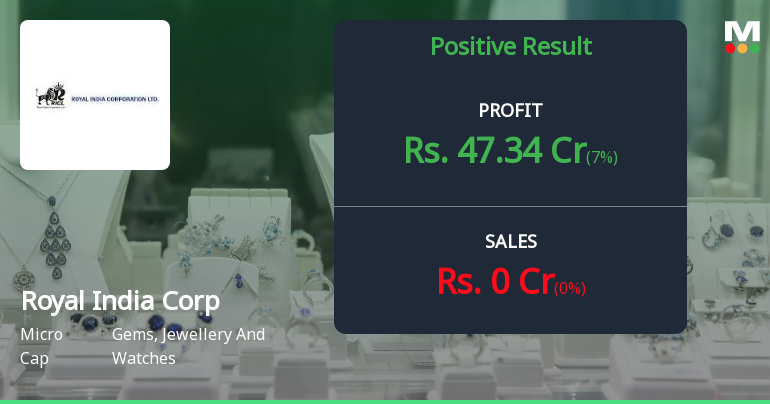
Royal India Corporation Q4 FY26: Extraordinary Other Income Masks Operational Collapse
Royal India Corporation Ltd., a micro-cap player in the gems and jewellery sector, reported a staggering consolidated net profit of ₹46.94 crores for Q4 FY26, representing an extraordinary 11,348.78% quarter-on-quarter surge from ₹0.41 crores in Q3 FY26. However, this headline figure conceals a deeply concerning operational reality: the company's core business has virtually collapsed, with net sales plummeting 99.29% year-on-year to just ₹0.50 crores, whilst the profit was entirely driven by exceptional other income of ₹73.32 crores.
Read full news article Announcements
Announcement under Regulation 30 (LODR)-Newspaper Publication
01-Jun-2026 | Source : BSEWe submit herewith the extract of the audited consolidated and standalone financial results of the Company for the quarter and financial year ended 31st March 2026 published in Financial Express (all reagions) and Mahasagar (local).
Results-Financial Results For Quarter And Financial Year Ended 31.03.2026
30-May-2026 | Source : BSEPursuant to Regulation 33(3) (d) of SEBI (Listing Obligations & Disclosure Requirements) Regulations 2015 we enclose the following: Audited Standalone and consolidated Financial Results along-with Independent Statutory Audit Report for the quarter and financial year ended 31st March 2026
Board Meeting Outcome for Declaration Of Outcome Of The Board Meeting Held On May 30 2026
30-May-2026 | Source : BSEthe Board of Directors of the Company at its meeting held today i.e. May 30 2026 which commenced at 11.00 a.m. and concluded at 01.00 p.m. have discussed considered and approved the following: 1. To consider and approve the Audited Standalone and consolidated financial results of the Company along-with Independent Statutory Auditor Report for the quarter and financial year ended March 31 2026 as per IND-AS which have been approved and taken on record at a meeting of the Board of Directors of the Company held on 30th May 2026. 2. Re-appointment of M/S M. Borar & Co. Chartered Accountants as an Internal Auditor for financial year 2026-2027 3. Noting of Secretarial Compliance Report issued by M/S Mayank Arora & Co.
Corporate Actions

No Upcoming Board Meetings

No Dividend history available

No Splits history available

No Bonus history available

No Rights history available
Quality key factors
Valuation key factors
Technicals key factors
 Technical Indicator Scale: Bearish, Mildly Bearish, Sideways, Mildly Bullish, Bullish Turned
 Shareholding Snapshot : Mar 2026
Shareholding Compare (%holding)
Non Institution
None
Held by 0 Schemes
Held by 0 FIIs
Manoj B Punamiya (13.76%)
Italindia Cotton Company Private Limited (7.28%)
45.45%
Quarterly Results Snapshot (Standalone) - Mar'26 - QoQ

QoQ Growth in quarter ended Mar 2026 is 0.00% vs -100.00% in Dec 2025
QoQ Growth in quarter ended Mar 2026 is 7,072.73% vs -62.92% in Dec 2025
Half Yearly Results Snapshot (Standalone) - Sep'25

Growth in half year ended Sep 2025 is -49.53% vs 380.52% in Sep 2024
Growth in half year ended Sep 2025 is 3,225.00% vs 91.58% in Sep 2024
Nine Monthly Results Snapshot (Standalone) - Dec'25
YoY Growth in nine months ended Dec 2025 is -69.26% vs 419.27% in Dec 2024
YoY Growth in nine months ended Dec 2025 is 8,185.71% vs 98.76% in Dec 2024
Annual Results Snapshot (Consolidated) - Mar'26
Not Applicable: The company has declared_date for only one period
Not Applicable: The company has declared_date for only one period
About Royal India Corporation Ltd

Company Coordinates


