
Compare Royale Manor with Similar Stocks
Total Returns (Price + Dividend) 
Royale Manor for the last several years.
Risk Adjusted Returns v/s
Returns Beta

News
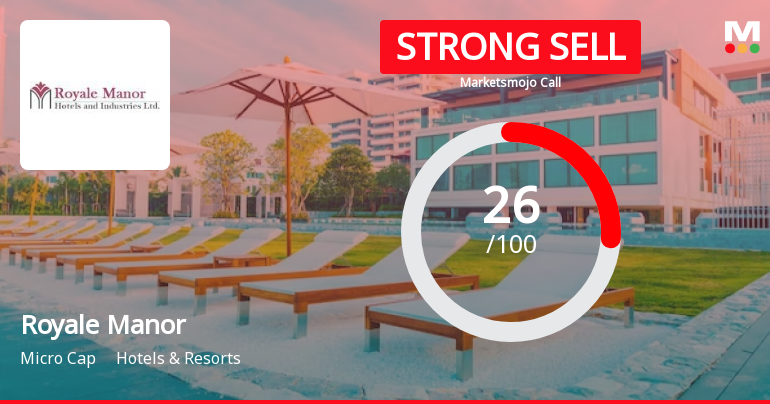
Royale Manor Hotels & Industries Ltd is Rated Strong Sell
Royale Manor Hotels & Industries Ltd is rated Strong Sell by MarketsMOJO. This rating was last updated on 18 Aug 2025, reflecting a reassessment of the stock’s outlook. However, the analysis and financial metrics discussed below are based on the company’s current position as of 17 June 2026, providing investors with the latest insights into its performance and prospects.
Read full news article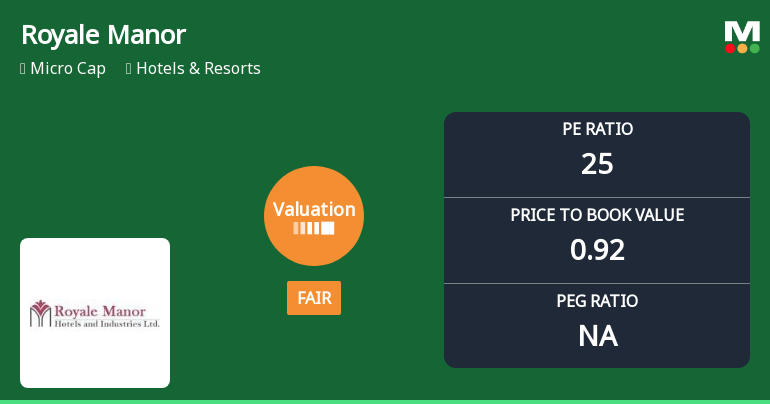
Royale Manor Hotels & Industries Ltd: Valuation Shifts Signal Renewed Price Attractiveness
Royale Manor Hotels & Industries Ltd has undergone a notable valuation adjustment, moving from an expensive to a fair pricing category, reflecting a significant shift in market perception. Despite a challenging performance track record and a micro-cap status within the Hotels & Resorts sector, the company’s current price-to-earnings (P/E) and price-to-book value (P/BV) ratios suggest a more attractive entry point relative to its historical and peer benchmarks.
Read full news articleAre Royale Manor Hotels & Industries Ltd latest results good or bad?
Royale Manor Hotels & Industries Ltd has reported its financial results for the quarter ending March 2026, revealing a mixed operational performance. The company achieved net sales of ₹7.08 crores, which reflects a sequential improvement of 7.60% from the previous quarter. However, this represents a year-on-year decline of 5.35% compared to ₹7.48 crores in the same quarter last year. This decline raises concerns about the company's ability to maintain its market share in a recovering hospitality sector. Net profit for the quarter stood at ₹1.56 crores, showing a significant sequential increase of 100.00% from ₹0.78 crores in the previous quarter. Nonetheless, this figure is down 13.81% from ₹1.81 crores reported in the same quarter last year, indicating challenges in sustaining profitability despite seasonal peaks. The operating margin, excluding other income, improved to 28.95%, marking a substantial seq...
Read full news article Announcements
Reg 32
30-May-2026 | Source : BSEReg 32
Announcement under Regulation 30 (LODR)-Newspaper Publication
30-May-2026 | Source : BSENewspaper Publication of Financial Results
Compliances-Reg.24(A)-Annual Secretarial Compliance
30-May-2026 | Source : BSEReg 24A
Corporate Actions

No Upcoming Board Meetings

No Dividend history available

No Splits history available

No Bonus history available

No Rights history available
Quality key factors
Valuation key factors
Technicals key factors
 Technical Indicator Scale: Bearish, Mildly Bearish, Sideways, Mildly Bullish, Bullish Turned
 Shareholding Snapshot : Mar 2026
Shareholding Compare (%holding)
Promoters
None
Held by 0 Schemes
Held by 0 FIIs
Shree Bala Finvest Private Limited. (15.31%)
Kailash Ramavatar Goenka (11.23%)
38.83%
Quarterly Results Snapshot (Standalone) - Mar'26 - YoY

YoY Growth in quarter ended Mar 2026 is -5.35% vs 7.16% in Mar 2025
YoY Growth in quarter ended Mar 2026 is -13.81% vs 17.53% in Mar 2025
Half Yearly Results Snapshot (Standalone) - Sep'25
Growth in half year ended Sep 2025 is -9.14% vs 6.06% in Sep 2024
Growth in half year ended Sep 2025 is -90.48% vs 6.78% in Sep 2024
Nine Monthly Results Snapshot (Standalone) - Dec'25

YoY Growth in nine months ended Dec 2025 is -2.42% vs -4.44% in Dec 2024
YoY Growth in nine months ended Dec 2025 is -34.88% vs -52.04% in Dec 2024
Annual Results Snapshot (Standalone) - Mar'26
YoY Growth in year ended Mar 2026 is -3.36% vs -0.98% in Mar 2025
YoY Growth in year ended Mar 2026 is -22.90% vs -26.54% in Mar 2025
About Royale Manor Hotels & Industries Ltd

Company Coordinates


