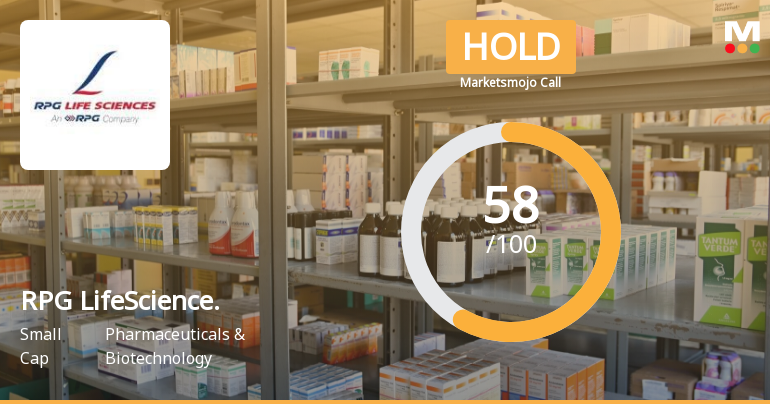
RPG LifeScience.

  • Market Cap: Small Cap
  • Industry: Pharmaceuticals & Biotechnology
  • ISIN: INE105J01010
  • NSEID: RPGLIFE
  • BSEID: 532983
INR
2,781.00
-69.2 (-2.43%)
BSENSE

Jul 30, 03:07 PM

BSE+NSE Vol: 21.8 k

  • Price Points
  • Score
  • Mojo Parameters
  • Total Return
  • News and Corporate Actions
  • Key factors
  • Shareholding
  • Financials
  • CompanyCV
stock-summaryPrice Point
High/Low

1Day

52 Week

Valuation
Technical
Day's Volume

CASH

21.8 k (17.54%) Volume

Shareholding (Jun 2026)

FII

0.95%

Held by 41 FIIs

DII

8.67%

Held by 1 DIIs

Promoter

72.95%

Why is RPG Life Sciences Ltd falling/rising?

30-Jul-2026

As of 29-Jul, RPG Life Sciences Ltd's stock price is Rs 2,846.90, down 1.19% and underperforming its sector. Despite a strong monthly gain of 25.35%, recent trading shows decreased investor interest and volatility, contributing to the stock's decline.

As of 29-Jul, RPG Life Sciences Ltd's stock price is falling, currently at Rs 2,846.90, reflecting a decrease of Rs 34.2 or 1.19%. The stock has underperformed its sector by 2.55% today and has experienced a consecutive decline over the last two days, with a total drop of 2.45% during this period. <BR><BR>Despite a strong performance over the past month, where the stock rose by 25.35%, recent trading activity indicates a lack of investor participation, as evidenced by a significant drop in delivery volume, which fell by 64.24% compared to the 5-day average. The stock also reached an intraday high of Rs 3,003.8 but fell to a low of Rs 2,774.2, suggesting volatility and uncertainty among investors.<BR><BR>While the company is net-debt free and has reported positive financial results, including the highest PAT and net sales in the last quarter, the current market sentiment appears to be negative, contributing to the stock's decline. Additionally, the stock's performance relative to the benchmark Sensex, which has gained 1.17% over the past week, further highlights its underperformance in the current trading environment.

View full answer

Are RPG Life Sciences Ltd latest results good or bad?

29-Jul-2026

RPG Life Sciences Ltd's latest Q1 FY27 results are positive, with a net profit of ₹30.76 crore (up 17% year-on-year) and revenue reaching ₹195.69 crore (up 15.85%). The company also improved its operating margin to 22.12% and achieved a return on equity of 20.40%, indicating strong operational performance and growth.

RPG Life Sciences Ltd's latest results for Q1 FY27 can be considered quite positive. The company reported a net profit of ₹30.76 crore, which reflects a year-on-year growth of 17%. Additionally, revenue grew by 15.85% compared to the same quarter last year, reaching an all-time high of ₹195.69 crore. This marks a sequential growth of 10.63% over the previous quarter, indicating strong momentum.<BR><BR>The operating margin improved to 22.12%, the highest in seven quarters, showcasing effective cost management and operational efficiency. Furthermore, the return on equity (ROE) stands at an impressive 20.40%, which is industry-leading.<BR><BR>Overall, the results highlight RPG Life Sciences' strengthening position in both domestic and export markets, supported by a diversified product portfolio. The company's ability to maintain double-digit revenue growth while expanding its operating margins signals a robust operational performance.

View full answer

Should I buy, sell or hold RPG Life Sciences Ltd?

29-Jul-2026

When is the next results date for RPG Life Sciences Ltd?

22-Jul-2026

The next results date for RPG Life Sciences Ltd is July 28, 2026.

The next results date for RPG Life Sciences Ltd is scheduled for July 28, 2026.

View full answer

How big is RPG LifeScience.?

11-Jun-2026

As of 10th June, RPG Life Sciences Ltd has a market capitalization of 3,502.00 Cr and reported net sales of 681.69 Cr and net profit of 206.23 Cr over the latest four quarters. Shareholder's funds and total assets data are not available.

As of 10th June, <BR><BR>Market Cap: RPG Life Sciences Ltd has a market capitalization of 3,502.00 Cr and is classified as a Small Cap company.<BR><BR>Recent Quarterly Performance: The sum of Net Sales for the latest 4 quarters is 681.69 Cr, while the sum of Net Profit for the same period is 206.23 Cr.<BR><BR>Balance Sheet Snapshot: The reporting period for the latest annual data is not specified, and the values for Shareholder's Funds and Total Assets are not available.

View full answer

Who are in the management team of RPG LifeScience.?

11-Jun-2026

The management team of RPG LifeScience includes Chairman H V Goenka, Managing Director C T Renganathan, and several Non-Executive Independent Directors, along with Company Secretary Rajesh Shirambekar, providing a blend of leadership and oversight.

The management team of RPG LifeScience includes the following individuals:<BR><BR>1. **H V Goenka** - Chairman<BR>2. **C T Renganathan** - Managing Director<BR>3. **C L Jain** - Non Executive Independent Director<BR>4. **Lalit S Kanodia** - Non Executive Independent Director<BR>5. **Mahesh S Gupta** - Non Executive Independent Director<BR>6. **Manoj K Maheshwari** - Non Executive Independent Director<BR>7. **Narendra Ambwani** - Non Executive Independent Director<BR>8. **Zahabiya Khorakiwala** - Non Executive Independent Director<BR>9. **Yugal Sikri** - Non Executive Independent Director<BR>10. **Sachin Nandgaonkar** - Non Executive Director<BR>11. **Rajesh Shirambekar** - Company Secretary<BR><BR>This team brings together a mix of leadership and independent oversight to guide the company.

View full answer

Who are the peers of the RPG LifeScience.?

11-Jun-2026

RPG LifeScience's peers include Advanced Enzyme, IOL Chemicals, Gufic BioScience, SMS Pharma, Aarti Drugs, Panacea Biotec, Novartis India, Dishman Carbogen, Solara Active, and Morepen Labs. Most peers show Below Average growth and management risk, with IOL Chemicals having the highest 1-year return at 43.27%, while RPG LifeScience's return is 3.90%.

Peers: The peers of RPG LifeScience are Advanced Enzyme, IOL Chemicals, Gufic BioScience, SMS Pharma, Aarti Drugs, Panacea Biotec, Novartis India, Dishman Carbogen, Solara Active, and Morepen Labs.<BR><BR>Quality Snapshot: Excellent management risk is observed at Advanced Enzyme, IOL Chemicals, RPG LifeScience, and Novartis India, while Average management risk is found at Gufic BioScience, SMS Pharma, Aarti Drugs, and Morepen Labs. Below Average management risk is noted at Panacea Biotec, Dishman Carbogen, and Solara Active. All peers exhibit Below Average growth except for Novartis India, which has Good growth, while Advanced Enzyme, IOL Chemicals, RPG LifeScience, Gufic BioScience, SMS Pharma, Aarti Drugs, and Morepen Labs show Below Average growth. Capital Structure is Excellent for Advanced Enzyme, IOL Chemicals, and Novartis India, Good for Aarti Drugs, Average for Gufic BioScience and SMS Pharma, and Below Average for Panacea Biotec, Dishman Carbogen, Solara Active, and Morepen Labs.<BR><BR>Return Snapshot: The peer with the highest 1-year return is IOL Chemicals at 43.27%, while the lowest is Dishman Carbogen at -38.27%. RPG LifeScience's own 1-year return is 3.90%, which is higher than Dishman Carbogen's but lower than IOL Chemicals'. Additionally, Dishman Carbogen and Aarti Drugs have negative six-month returns.

View full answer

What does RPG LifeScience. do?

10-Jun-2026

RPG Life Sciences Ltd manufactures and markets pharmaceutical formulations and active pharmaceutical ingredients. As of March 2026, it reported net sales of ₹177 Cr and a net profit of ₹30 Cr, with a market cap of ₹3,502 Cr.

Overview:<BR>RPG Life Sciences Ltd is engaged in the manufacturing and marketing of Formulations (Finished Dosage Forms) and Active Pharmaceutical Ingredients (APIs) within the Pharmaceuticals & Biotechnology industry, classified as a Small Cap company.<BR><BR>History:<BR>The company was incorporated in 2007, originally named 'RPG Pharmaceuticals Limited', and it transitioned from its previous identity as Searle India Limited, which began as a joint venture in 1968. The latest quarterly results reported net sales and profit for March 2026.<BR><BR>Financial Snapshot:<BR>- Net Sales: 177 Cr (Quarterly Results - Mar 2026)<BR>- Net Profit: 30 Cr (Quarterly Results - Mar 2026)<BR>- Market Cap: INR 3,502 Cr (Small Cap)<BR><BR>Key Metrics:<BR>- P/E: 32.00<BR>- Industry P/E: 34<BR>- Dividend Yield: 1.15%<BR>- Debt-Equity: -0.36<BR>- Return on Equity: 18.57%<BR>- Price to Book: 5.72<BR><BR>Contact Details:<BR>Address: RPG House, 463 Dr Annie Besant Road Worli Mumbai Maharashtra : 400030<BR>Tel: 91-022-24981650<BR>Email: info@rpglifesciences.com<BR>Website: http://www.rpglifesciences.com

View full answer

Is RPG LifeScience. technically bullish or bearish?

04-Dec-2025

As of December 3, 2025, the technical trend for RPG LifeScience has shifted to mildly bearish, influenced by bearish signals from the MACD, KST, and Bollinger Bands, despite a mildly bullish daily moving average.

As of 3 December 2025, the technical trend has changed from sideways to mildly bearish. The current technical stance is mildly bearish, driven by several key indicators. The MACD is bearish on the weekly chart and mildly bearish on the monthly chart, while the KST also shows bearish signals on both time frames. The Dow Theory indicates a mildly bearish stance for both weekly and monthly periods. Although the daily moving averages show a mildly bullish trend, the overall sentiment is dampened by the bearish signals from the Bollinger Bands on the weekly chart and the mildly bearish OBV on the weekly chart. The RSI shows no signals on both weekly and monthly time frames, indicating a lack of momentum. Overall, the combination of these indicators suggests a cautious outlook for RPG LifeScience in the near term.

View full answer

Is RPG LifeScience. overvalued or undervalued?

10-Nov-2025

As of November 7, 2025, RPG LifeScience is fairly valued with a PE Ratio of 35.54, strong operational efficiency indicated by a ROCE of 46.94% and ROE of 21.01%, and has outperformed the Sensex over the last three and five years, making it an attractive investment compared to its peers.

As of 7 November 2025, the valuation grade for RPG LifeScience has moved from expensive to fair. The company is currently fairly valued based on its financial metrics. Key ratios include a PE Ratio of 35.54, an EV to EBITDA of 24.78, and a PEG Ratio of 0.84, indicating a relatively attractive growth potential compared to its price.<BR><BR>In comparison to its peers, RPG LifeScience's PE Ratio is slightly higher than Sun Pharma's 35.17 but significantly lower than Divi's Lab's 71.11, which is categorized as very expensive. Additionally, while Cipla is rated as attractive with a PE of 22.33, RPG LifeScience's strong ROCE of 46.94% and ROE of 21.01% suggest robust operational efficiency. Notably, RPG LifeScience has outperformed the Sensex over the last three and five years, with returns of 174.55% and 559.32%, respectively, reinforcing its competitive position in the market.

View full answer

How has been the historical performance of RPG LifeScience.?

17-Oct-2025

RPG LifeScience has shown consistent growth in net sales and profits, with net sales rising from 330.16 Cr in March 2019 to 653.43 Cr in March 2025, and profit after tax increasing from 10.81 Cr to 183.24 Cr in the same period, reflecting strong financial performance and enhanced shareholder value.

Answer:<BR>The historical performance of RPG LifeScience shows a consistent growth trajectory in net sales and profits over the years. <BR><BR>Breakdown:<BR>RPG LifeScience's net sales have increased from 330.16 Cr in March 2019 to 653.43 Cr in March 2025, reflecting a strong upward trend. The total operating income has followed the same pattern, rising from 330.16 Cr in March 2019 to 653.43 Cr in March 2025. The company's operating profit, excluding other income, has also seen significant growth, climbing from 33.56 Cr in March 2019 to 159.65 Cr in March 2025. This is complemented by an increase in profit before tax, which surged from 15.05 Cr in March 2019 to 232.88 Cr in March 2025. The profit after tax has similarly escalated from 10.81 Cr in March 2019 to 183.24 Cr in March 2025, indicating improved profitability. The earnings per share have dramatically increased from 6.54 in March 2019 to 110.8 in March 2025, showcasing enhanced shareholder value. Overall, RPG LifeScience has demonstrated robust financial performance with increasing revenues and profits over the years.

View full answer

Who are the top shareholders of the RPG LifeScience.?

17-Jul-2025

The top shareholders of RPG LifeScience include Nucleus Life Trust with 53.94%, Authum Investment And Infrastructure Limited at 2.02%, and individual investors holding 15.33%. Additionally, mutual funds hold 3.53%, and 46 foreign institutional investors have a combined stake of 1.45%, with no pledged promoter holdings reported.

The top shareholders of RPG LifeScience include the promoters, with Nucleus Life Trust, managed by Mr. Harsh Vardhan Goenka as a trustee, holding the largest stake at 53.94%. Other significant shareholders include Authum Investment And Infrastructure Limited, which holds 2.02%, and individual investors collectively owning 15.33%. Additionally, the company has mutual funds represented by six schemes, holding 3.53%, and 46 foreign institutional investors (FIIs) with a combined holding of 1.45%. There are no pledged promoter holdings reported.

View full answer

Has RPG LifeScience. declared dividend?

06-Jun-2025

RPG Life Sciences Ltd has declared a 200% dividend, amounting to ₹16 per share, with an ex-date of June 28, 2024. The company has shown significant total returns over various periods, particularly in the long term, despite a recent short-term decline.

RPG Life Sciences Ltd has declared a 200% dividend.<BR><BR>Dividend Details:<BR>- Percentage announced: 200%<BR>- Amount per share: 16<BR>- Ex-date: 28 Jun 24<BR><BR>Dividend Yield: 0.74%.<BR><BR>Total Returns by Period:<BR>In the last 6 months, the price return was -2.98%, with a dividend return of 0%, resulting in a total return of -2.98%.<BR><BR>Over the past year, the price return was 47.74%, the dividend return was 1.03%, leading to a total return of 48.77%.<BR><BR>In the 2-year period, the price return was 168.65%, the dividend return was 3.07%, culminating in a total return of 171.72%.<BR><BR>For the 3-year period, the price return was 316.33%, with a dividend return of 7.27%, resulting in a total return of 323.6%.<BR><BR>In the last 4 years, the price return was 388.09%, the dividend return was 9.96%, giving a total return of 398.05%.<BR><BR>Over the past 5 years, the price return was 661.83%, with a dividend return of 16.67%, leading to a total return of 678.5%.<BR><BR>Overall, RPG Life Sciences Ltd has declared a substantial dividend, and the total returns over various periods reflect significant growth, particularly in the longer term, despite a recent decline in the short-term price return.

View full answer
iScoreScore
Click here to find our call on this stock
Strong Sell
Sell
Hold
Buy
Strong Buy

Dashboard

1

The company is Net-Debt Free

 
2

Poor long term growth as Net Sales has grown by an annual rate of 12.60% and Operating profit at 17.35% over the last 5 years

 
3

Positive results in Jun 26

4

With ROE of 19.3, it has a Expensive valuation with a 7.8 Price to Book Value

5

Increasing Participation by Institutional Investors

6

Consistent Returns over the last 3 years

stock-summaryMojo Parameters

Mojo Parameters

Loading Valuation Snapshot...

Stock DNA

stock-summary
Industry

Pharmaceuticals & Biotechnology

stock-summary
Market cap

INR 4,600 Cr (Small Cap)

stock-summary
P/E

40.00

stock-summary
Industry P/E

37

stock-summary
Dividend Yield

0.84%

stock-summary
Debt Equity

-0.36

stock-summary
Return on Equity

19.27%

stock-summary
Price to Book

7.78

Revenue and Profits:
Net Sales:
196 Cr
(Quarterly Results - Jun 2026)
Net Profit:
31 Cr
stock-summaryTotal Returns
Total Returns (Price + Dividend) stock-summary
Dividend Yield (0.84%)
TimePeriod
Price Return
Dividend Return
Total Return
3 Months
21.18%
0.99%
22.17%
6 Months
38.5%
1.20%
39.7%
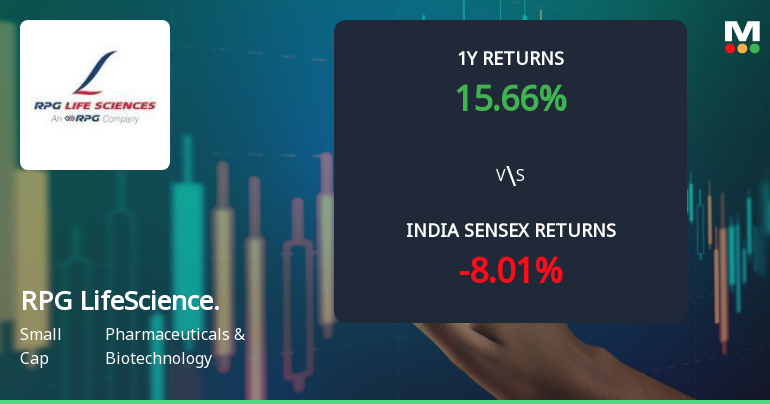
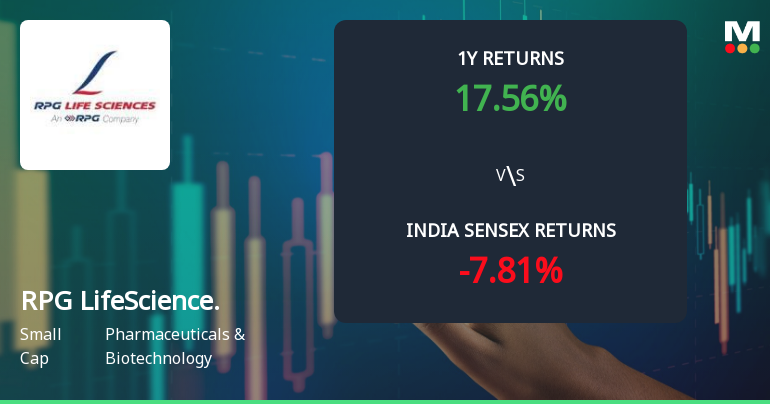
1 Year
15.6%
1.01%
16.61%
2 Years
40.21%
1.28%
41.49%
3 Years
167.55%
3.86%
171.41%
4 Years
359.33%
7.68%
367.01%
5 Years
445.99%
13.10%
459.09%

Latest dividend: 23.84168332928447 per share ex-dividend date: Jul-09-2026

Risk Adjusted Returns v/s stock-summary
Returns Beta
Icon
Beta has not been calculated since enough price history is not available
stock-summaryNews & Corporate Actions

News

Announcements stock-summary

RPG Life Sciences Limited - Other General Purpose

28-Nov-2019 | Source : NSE

RPG Life Sciences Limited has submitted to the Exchange a copy of disclosure of Related Party Transactions for the half year ended September 30, 2019.

RPG Life Sciences Limited - Updates

01-Nov-2019 | Source : NSE

RPG Life Sciences Limited has informed the Exchange regarding 'In terms of the Regulation 30 read with Schedule Ill of the SEBI (Listing Obligations and Disclosure Requirements) Regulations, 2015, please find enclosed herewith a copy of the newspaper publications with respect to Unaudited Financial Results for the quarter and half year ended September 30, 2019.

RPG Life Sciences Limited - Outcome of Board Meeting

31-Oct-2019 | Source : NSE

RPG Life Sciences Limited has informed the Exchange regarding Board meeting held on October 30, 2019.

Corporate Actions stock-summary

stock-summary
BOARD MEETING

No Upcoming Board Meetings

stock-summary
DIVIDEND

RPG Life Sciences Ltd has declared 300% dividend, ex-date: 09 Jul 26

stock-summary
SPLITS

No Splits history available

stock-summary
BONUS

No Bonus history available

stock-summary
RIGHTS

No Rights history available

stock-summaryKey Factors

Quality key factors stock-summary

Factor
Value
Sales Growth (5y)
12.60%
EBIT Growth (5y)
17.35%
EBIT to Interest (avg)
100.00
Debt to EBITDA (avg)
Net Debt is too low
Net Debt to Equity (avg)
-0.36
Sales to Capital Employed (avg)
1.53
Tax Ratio
25.33%
Dividend Payout Ratio
21.66%
Pledged Shares
0
Institutional Holding
9.63%
ROCE (avg)
41.11%
ROE (avg)
20.40%

Valuation key factors

Factor
Value
P/E Ratio
40
Industry P/E
37
Price to Book Value
7.78
EV to EBIT
33.74
EV to EBITDA
28.91
EV to Capital Employed
11.67
EV to Sales
6.11
PEG Ratio
1.75
Dividend Yield
0.84%
ROCE (Latest)
32.66%
ROE (Latest)
19.27%

Technicals key factors

Indicator
Weekly
Monthly
MACD
Bullish
Mildly Bearish
RSI
Bearish
No Signal
Bollinger Bands
Mildly Bullish
Bullish
Moving Averages
Bullish (Daily)
KST
Bullish
Mildly Bearish
Dow Theory
Bullish
Bullish
OBV
No Trend
Bullish
stock-summary Technical Indicator Scale: Bearish, Mildly Bearish, Sideways, Mildly Bullish, Bullish  Turned 
stock-summaryShareholding
Shareholding Snapshot : Jun 2026stock-summary
Shareholding Compare (%holding) stock-summary
Majority shareholders

Promoters

Pledged Promoter Holdings

None

Mutual Funds

Held by 3 Schemes (0.04%)

FIIs

Held by 41 FIIs (0.95%)

Promoter with highest holding

Nucleus Life Trust (mr. Harsh Vardhan Goenka Is A Trustee) (53.94%)

Highest Public shareholder

Clarus Capital I (5.59%)

Individual Investors Holdings

13.88%

stock-summaryFinancial
[
  {
    "link": "quarterly",
    "btn_text": "All Quarterly Results",
    "header": "Quarterly Results Snapshot (Standalone) - Jun'26 - QoQ",
    "rhs": [
      {
        "prefix": "Net Sales ",
        "suffix": "QoQ Growth in quarter ended Jun 2026 is 10.63% vs -1.74% in Mar 2026",
        "dir": 1
      },
      {
        "prefix": "Standalone Net Profit ",
        "suffix": "QoQ Growth in quarter ended Jun 2026 is 2.24% vs 35.11% in Mar 2026",
        "dir": -1
      }
    ],
    "table": {
      "header": [
        "Jun'26",
        "Mar'26",
        "Change(%)"
      ],
      "body": [
        {
          "field": "Net Sales",
          "val1": "195.69",
          "val2": "176.89",
          "chgp": "10.63%",
          "chgp_class": "positive"
        },
        {
          "field": "Operating Profit (PBDIT) excl Other Income",
          "val1": "43.58",
          "val2": "32.87",
          "chgp": "32.58%",
          "chgp_class": "positive"
        },
        {
          "field": "Interest",
          "val1": "0.63",
          "val2": "0.39",
          "chgp": "61.54%",
          "chgp_class": "negative"
        },
        {
          "field": "Exceptional Items",
          "val1": "0.00",
          "val2": "1.10",
          "chgp": "-100.00%",
          "chgp_class": "negative"
        },
        {
          "field": "Standalone Net Profit",
          "val1": "30.57",
          "val2": "29.90",
          "chgp": "2.24%",
          "chgp_class": "positive"
        },
        {
          "field": "Operating Profit Margin (Excl OI)",
          "val1": "22.27%",
          "val2": "18.58%",
          "chgp": "3.69%",
          "chgp_class": "positive"
        }
      ]
    }
  },
  {
    "link": "half-yearly",
    "btn_text": "All Half Yearly Results",
    "header": "Half Yearly Results Snapshot (Standalone) - Sep'25",
    "rhs": [
      {
        "prefix": "Net Sales ",
        "suffix": " Growth in half year ended Sep 2025 is 3.84% vs 12.04% in Sep 2024",
        "dir": -1
      },
      {
        "prefix": "Standalone Net Profit ",
        "suffix": " Growth in half year ended Sep 2025 is 103.94% vs -35.45% in Sep 2024",
        "dir": 1
      }
    ],
    "table": {
      "header": [
        "Sep'25",
        "Sep'24",
        "Change(%)"
      ],
      "body": [
        {
          "field": "Net Sales",
          "val1": "350.60",
          "val2": "337.63",
          "chgp": "3.84%",
          "chgp_class": "positive"
        },
        {
          "field": "Operating Profit (PBDIT) excl Other Income",
          "val1": "74.50",
          "val2": "85.00",
          "chgp": "-12.35%",
          "chgp_class": "negative"
        },
        {
          "field": "Interest",
          "val1": "0.25",
          "val2": "0.32",
          "chgp": "-21.88%",
          "chgp_class": "positive"
        },
        {
          "field": "Exceptional Items",
          "val1": "11.22",
          "val2": "-27.30",
          "chgp": "141.10%",
          "chgp_class": "positive"
        },
        {
          "field": "Standalone Net Profit",
          "val1": "63.14",
          "val2": "30.96",
          "chgp": "103.94%",
          "chgp_class": "positive"
        },
        {
          "field": "Operating Profit Margin (Excl OI)",
          "val1": "21.25%",
          "val2": "25.18%",
          "chgp": "-3.93%",
          "chgp_class": "negative"
        }
      ]
    }
  },
  {
    "link": "nine-monthly",
    "btn_text": "All Nine Monthly Results",
    "header": "Nine Monthly Results Snapshot (Standalone) - Dec'25",
    "rhs": [
      {
        "prefix": "Net Sales ",
        "suffix": "YoY Growth in nine months ended Dec 2025 is 3.98% vs 12.15% in Dec 2024",
        "dir": -1
      },
      {
        "prefix": "Standalone Net Profit ",
        "suffix": "YoY Growth in nine months ended Dec 2025 is 29.41% vs -11.46% in Dec 2024",
        "dir": 1
      }
    ],
    "table": {
      "header": [
        "Dec'25",
        "Dec'24",
        "Change(%)"
      ],
      "body": [
        {
          "field": "Net Sales",
          "val1": "530.63",
          "val2": "510.34",
          "chgp": "3.98%",
          "chgp_class": "positive"
        },
        {
          "field": "Operating Profit (PBDIT) excl Other Income",
          "val1": "114.26",
          "val2": "134.16",
          "chgp": "-14.83%",
          "chgp_class": "negative"
        },
        {
          "field": "Interest",
          "val1": "0.50",
          "val2": "0.44",
          "chgp": "13.64%",
          "chgp_class": "negative"
        },
        {
          "field": "Exceptional Items",
          "val1": "2.80",
          "val2": "-27.30",
          "chgp": "110.26%",
          "chgp_class": "positive"
        },
        {
          "field": "Standalone Net Profit",
          "val1": "85.27",
          "val2": "65.89",
          "chgp": "29.41%",
          "chgp_class": "positive"
        },
        {
          "field": "Operating Profit Margin (Excl OI)",
          "val1": "21.53%",
          "val2": "26.29%",
          "chgp": "-4.76%",
          "chgp_class": "negative"
        }
      ]
    }
  },
  {
    "link": "annual",
    "btn_text": "All Annual Results",
    "header": "Annual Results Snapshot (Standalone) - Mar'26",
    "rhs": [
      {
        "prefix": "Net Sales ",
        "suffix": "YoY Growth in year ended Mar 2026 is 8.28% vs 12.26% in Mar 2025",
        "dir": -1
      },
      {
        "prefix": "Standalone Net Profit ",
        "suffix": "YoY Growth in year ended Mar 2026 is -37.15% vs 109.03% in Mar 2025",
        "dir": -1
      }
    ],
    "table": {
      "header": [
        "Mar'26",
        "Mar'25",
        "Change(%)"
      ],
      "body": [
        {
          "field": "Net Sales",
          "val1": "707.52",
          "val2": "653.43",
          "chgp": "8.28%",
          "chgp_class": "positive"
        },
        {
          "field": "Operating Profit (PBDIT) excl Other Income",
          "val1": "147.13",
          "val2": "159.65",
          "chgp": "-7.84%",
          "chgp_class": "negative"
        },
        {
          "field": "Interest",
          "val1": "0.89",
          "val2": "0.62",
          "chgp": "43.55%",
          "chgp_class": "negative"
        },
        {
          "field": "Exceptional Items",
          "val1": "3.90",
          "val2": "82.60",
          "chgp": "-95.28%",
          "chgp_class": "negative"
        },
        {
          "field": "Standalone Net Profit",
          "val1": "115.17",
          "val2": "183.24",
          "chgp": "-37.15%",
          "chgp_class": "negative"
        },
        {
          "field": "Operating Profit Margin (Excl OI)",
          "val1": "20.80%",
          "val2": "24.43%",
          "chgp": "-3.63%",
          "chgp_class": "negative"
        }
      ]
    }
  }
]

Quarterly Results Snapshot (Standalone) - Jun'26 - QoQstock-summary

Jun'26
Mar'26
Change(%)
Net Sales
195.69
176.89
10.63%
Operating Profit (PBDIT) excl Other Income
43.58
32.87
32.58%
Interest
0.63
0.39
61.54%
Exceptional Items
0.00
1.10
-100.00%
Standalone Net Profit
30.57
29.90
2.24%
Operating Profit Margin (Excl OI)
22.27%
18.58%
3.69%
Values in Rs Cr.
Direction Arrows
Net Sales

QoQ Growth in quarter ended Jun 2026 is 10.63% vs -1.74% in Mar 2026

Direction Arrows
Standalone Net Profit

QoQ Growth in quarter ended Jun 2026 is 2.24% vs 35.11% in Mar 2026

Half Yearly Results Snapshot (Standalone) - Sep'25stock-summary

Sep'25
Sep'24
Change(%)
Net Sales
350.60
337.63
3.84%
Operating Profit (PBDIT) excl Other Income
74.50
85.00
-12.35%
Interest
0.25
0.32
-21.88%
Exceptional Items
11.22
-27.30
141.10%
Standalone Net Profit
63.14
30.96
103.94%
Operating Profit Margin (Excl OI)
21.25%
25.18%
-3.93%
Values in Rs Cr.
Direction Arrows
Net Sales

Growth in half year ended Sep 2025 is 3.84% vs 12.04% in Sep 2024

Direction Arrows
Standalone Net Profit

Growth in half year ended Sep 2025 is 103.94% vs -35.45% in Sep 2024

Nine Monthly Results Snapshot (Standalone) - Dec'25stock-summary

Dec'25
Dec'24
Change(%)
Net Sales
530.63
510.34
3.98%
Operating Profit (PBDIT) excl Other Income
114.26
134.16
-14.83%
Interest
0.50
0.44
13.64%
Exceptional Items
2.80
-27.30
110.26%
Standalone Net Profit
85.27
65.89
29.41%
Operating Profit Margin (Excl OI)
21.53%
26.29%
-4.76%
Values in Rs Cr.
Direction Arrows
Net Sales

YoY Growth in nine months ended Dec 2025 is 3.98% vs 12.15% in Dec 2024

Direction Arrows
Standalone Net Profit

YoY Growth in nine months ended Dec 2025 is 29.41% vs -11.46% in Dec 2024

Annual Results Snapshot (Standalone) - Mar'26stock-summary

Mar'26
Mar'25
Change(%)
Net Sales
707.52
653.43
8.28%
Operating Profit (PBDIT) excl Other Income
147.13
159.65
-7.84%
Interest
0.89
0.62
43.55%
Exceptional Items
3.90
82.60
-95.28%
Standalone Net Profit
115.17
183.24
-37.15%
Operating Profit Margin (Excl OI)
20.80%
24.43%
-3.63%
Values in Rs Cr.
Direction Arrows
Net Sales

YoY Growth in year ended Mar 2026 is 8.28% vs 12.26% in Mar 2025

Direction Arrows
Standalone Net Profit

YoY Growth in year ended Mar 2026 is -37.15% vs 109.03% in Mar 2025

stock-summaryCompany CV
About RPG Life Sciences Ltd stock-summary
stock-summary
RPG Life Sciences Ltd
Small Cap
Pharmaceuticals & Biotechnology
RPG Life Sciences Limited, formerly Searle India Limited, started in 1968 as a joint venture with GD Searle, USA. In 1993, GD Searle withdrew from India and sold its holdings to RPG Group. The Company is engaged in manufacturing and marketing of Formulations (Finished Dosage Forms) and Active Pharmaceutical Ingredients (APIs). RPG Life Sciences Limited was incorporated on March 29, 2007 with the name 'RPG Pharmaceuticals Limited' .
Company Coordinates stock-summary
Company Details
RPG House, 463 Dr Annie Besant Road Worli Mumbai Maharashtra : 400030
stock-summary
Tel: 91-022-24981650
stock-summary
info@rpglifesciences.com
Registrar Details
Link Intime India Pvt Ltd, C-13 Pannalal Silk Compound, L B S Marg, Bhandup , Mumbai