
Compare RPSG Ventures with Similar Stocks
Dashboard
Low ability to service debt as the company has a high Debt to EBITDA ratio of 5.14 times
- Low ability to service debt as the company has a high Debt to EBITDA ratio of 5.14 times
- The company has been able to generate a Return on Equity (avg) of 1.04% signifying low profitability per unit of shareholders funds
Healthy long term growth as Operating profit has grown by an annual rate 20.01%
Negative results in Mar 26
With ROCE of 11.4, it has a Very Attractive valuation with a 1 Enterprise value to Capital Employed
Despite the size of the company, domestic mutual funds hold only 0.01% of the company
Stock DNA
Commercial Services & Supplies
INR 2,989 Cr (Small Cap)
NA (Loss Making)
47
0.00%
2.90
-1.50%
1.18
Total Returns (Price + Dividend) 
RPSG Ventures for the last several years.
Risk Adjusted Returns v/s
Returns Beta

News
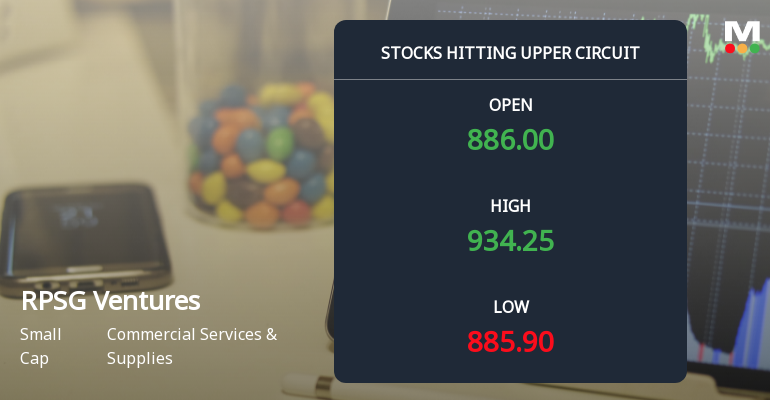
RPSG Ventures Ltd Locks at Upper Circuit With 4.67% Gain — Buyers Queue, Sellers Absent
At Rs 937.9, the buying was done — not because demand dried up, but because the exchange wouldn't let the stock go any higher. RPSG Ventures Ltd locked at its upper circuit of 5% on 7 Jul 2026, with buyers queuing and no sellers willing to part with shares.
Read full news article
RPSG Ventures Ltd Upgraded to Hold by MarketsMOJO on Technical and Valuation Improvements
RPSG Ventures Ltd has seen its investment rating upgraded from Sell to Hold, driven primarily by a shift in technical indicators and an attractive valuation profile despite recent financial setbacks. The company’s long-term growth prospects remain intact, supported by solid operating profit expansion and a valuation discount relative to peers, even as short-term financial performance and debt servicing capacity continue to pose challenges.
Read full news article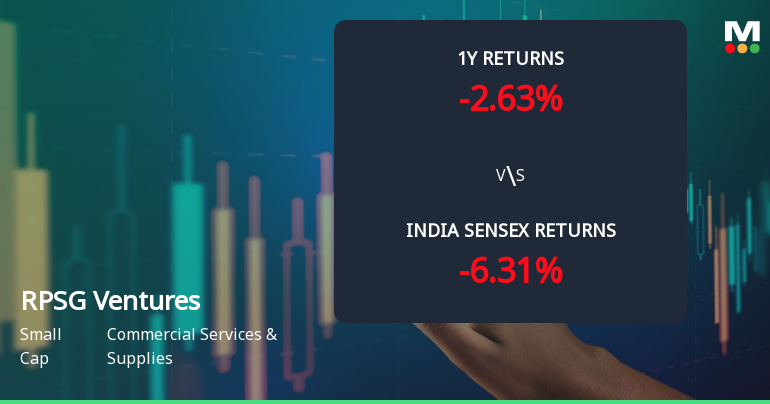
RPSG Ventures Ltd Technical Momentum Shifts Signal Mild Bullish Outlook
RPSG Ventures Ltd has exhibited a notable shift in its technical momentum, transitioning from a sideways trend to a mildly bullish stance. This change is underscored by mixed signals from key technical indicators such as MACD, RSI, Bollinger Bands, and moving averages, suggesting cautious optimism for investors amid a small-cap commercial services sector backdrop.
Read full news article Announcements
CESC Ventures Limited - Updates
09-Dec-2019 | Source : NSECESC Ventures Limited has informed the Exchange regarding 'We attach herewith a Certificate dated 06 December, 2019 under Regulation 74(5) of SEBI (Depositories
CESC Ventures Limited - Updates
18-Nov-2019 | Source : NSECESC Ventures Limited has informed the Exchange regarding 'Further to our letter No. SEC: 00147 dated 14 November, 2019, please find enclosed copies of newspaper publications as published today in all the editions of Business Standard in English language and Aajkal in Bengali.'.
CESC Ventures Limited - Demerger
15-Nov-2019 | Source : NSEDemerger In continuation of our earlier intimation, pls find the update on merger.
Corporate Actions

No Upcoming Board Meetings

No Dividend history available

No Splits history available

No Bonus history available

No Rights history available
Quality key factors
Valuation key factors
Technicals key factors
 Technical Indicator Scale: Bearish, Mildly Bearish, Sideways, Mildly Bullish, Bullish Turned
 Shareholding Snapshot : Mar 2026
Shareholding Compare (%holding)
Promoters
None
Held by 6 Schemes (0.0%)
Held by 53 FIIs (3.27%)
Rainbow Investments Limited (39.08%)
Ashish Dhawan (3.73%)
23.33%
Quarterly Results Snapshot (Consolidated) - Mar'26 - QoQ

QoQ Growth in quarter ended Mar 2026 is 6.19% vs 3.30% in Dec 2025
QoQ Growth in quarter ended Mar 2026 is 48.45% vs -114.44% in Dec 2025
Half Yearly Results Snapshot (Consolidated) - Sep'25
Growth in half year ended Sep 2025 is 20.45% vs 14.63% in Sep 2024
Growth in half year ended Sep 2025 is 29.19% vs -79.69% in Sep 2024
Nine Monthly Results Snapshot (Consolidated) - Dec'25

YoY Growth in nine months ended Dec 2025 is 18.81% vs 19.16% in Dec 2024
YoY Growth in nine months ended Dec 2025 is -123.99% vs -162.68% in Dec 2024
Annual Results Snapshot (Consolidated) - Mar'26
YoY Growth in year ended Mar 2026 is 17.85% vs 20.85% in Mar 2025
YoY Growth in year ended Mar 2026 is -181.36% vs -15.50% in Mar 2025
About RPSG Ventures Ltd

Company Coordinates


