
Compare RR Metalmakers with Similar Stocks
Dashboard
Weak Long Term Fundamental Strength with a -143.54% CAGR growth in Operating Profits over the last 5 years
- Low ability to service debt as the company has a high Debt to EBITDA ratio of 13.13 times
- The company has been able to generate a Return on Equity (avg) of 6.38% signifying low profitability per unit of shareholders funds
Risky - Negative Operating Profits
Stock DNA
Non - Ferrous Metals
INR 56 Cr (Micro Cap)
390.00
23
0.00%
1.55
-29.06%
6.64
Total Returns (Price + Dividend) 
Latest dividend: 0.5 per share ex-dividend date: Jun-06-2018
Risk Adjusted Returns v/s
Returns Beta

News
RR Metalmakers India Ltd is Rated Sell
RR Metalmakers India Ltd is rated 'Sell' by MarketsMOJO, with this rating last updated on 02 June 2026. However, the analysis and financial metrics discussed here reflect the stock's current position as of 15 July 2026, providing investors with an up-to-date perspective on the company’s performance and outlook.
Read full news article
RR Metalmakers India Ltd is Rated Sell
RR Metalmakers India Ltd is rated 'Sell' by MarketsMOJO, with this rating last updated on 02 June 2026. However, the analysis and financial metrics discussed here reflect the company’s current position as of 30 June 2026, providing investors with the latest insights into its performance and outlook.
Read full news article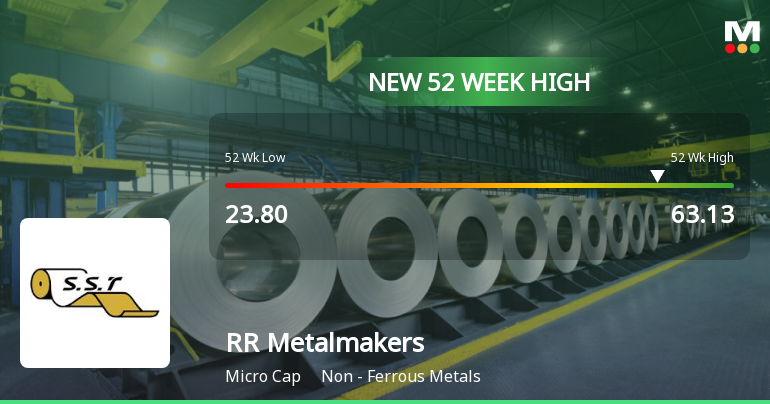
Broad-Based Technical Strength Lifts RR Metalmakers India Ltd to 52-Week High of Rs 63.13
Surging to a fresh 52-week high of Rs 63.13 on 22 Jun 2026, RR Metalmakers India Ltd has demonstrated remarkable price momentum, rallying over 117% in the past 21 trading sessions. This milestone caps a year-long ascent from Rs 23.80, significantly outperforming the Sensex’s decline of 6.34% over the same period.
Read full news article Announcements
Announcement under Regulation 30 (LODR)-Newspaper Publication
16-Jul-2026 | Source : BSENotice of 31st AGM and E-voting information published in newspapers is enclosed.
Reg. 34 (1) Annual Report.
15-Jul-2026 | Source : BSEAnnuual Report 2025-26 is enclosed.
Announcement Under Regulation 30- Letter Sent To Shareholders
15-Jul-2026 | Source : BSEEnclosed.
Corporate Actions

No Upcoming Board Meetings

RR Metalmakers India Ltd has declared 5% dividend, ex-date: 06 Jun 18

No Splits history available

No Bonus history available

No Rights history available
Quality key factors
Valuation key factors
Technicals key factors
 Technical Indicator Scale: Bearish, Mildly Bearish, Sideways, Mildly Bullish, Bullish Turned
 Shareholding Snapshot : Mar 2026
Shareholding Compare (%holding)
Promoters
None
Held by 0 Schemes
Held by 0 FIIs
Virat Sevantilal Shah (40.41%)
Patel Keyur Sureshkumar (3.93%)
23.08%
Quarterly Results Snapshot (Standalone) - Mar'26 - QoQ

QoQ Growth in quarter ended Mar 2026 is 133.05% vs -44.20% in Dec 2025
QoQ Growth in quarter ended Mar 2026 is 158.01% vs -1,756.52% in Dec 2025
Half Yearly Results Snapshot (Standalone) - Sep'25
Growth in half year ended Sep 2025 is 11.55% vs -35.54% in Sep 2024
Growth in half year ended Sep 2025 is 61.02% vs 18.00% in Sep 2024
Nine Monthly Results Snapshot (Standalone) - Dec'25
YoY Growth in nine months ended Dec 2025 is 12.82% vs -34.17% in Dec 2024

YoY Growth in nine months ended Dec 2025 is -330.65% vs 8.77% in Dec 2024
Annual Results Snapshot (Standalone) - Mar'26
YoY Growth in year ended Mar 2026 is 67.19% vs -46.08% in Mar 2025
YoY Growth in year ended Mar 2026 is -139.88% vs 60.00% in Mar 2025
About RR Metalmakers India Ltd

Company Coordinates


