
Compare RTS Power Corpn. with Similar Stocks
Stock DNA
Other Electrical Equipment
INR 96 Cr (Micro Cap)
43.00
48
0.00%
0.09
1.50%
0.66
Total Returns (Price + Dividend) 
Latest dividend: 0.5 per share ex-dividend date: Sep-22-2011
Risk Adjusted Returns v/s
Returns Beta

News

RTS Power Corporation Ltd is Rated Sell
RTS Power Corporation Ltd is rated 'Sell' by MarketsMOJO, with this rating last updated on 16 Feb 2026. However, the analysis and financial metrics discussed here reflect the stock's current position as of 16 June 2026, providing investors with an up-to-date view of the company’s fundamentals, returns, and market performance.
Read full news article
RTS Power Corporation Ltd is Rated Sell
RTS Power Corporation Ltd is rated 'Sell' by MarketsMOJO, with this rating last updated on 16 Feb 2026. However, the analysis and financial metrics discussed here reflect the stock's current position as of 01 June 2026, providing investors with an up-to-date view of the company’s fundamentals, returns, and market performance.
Read full news article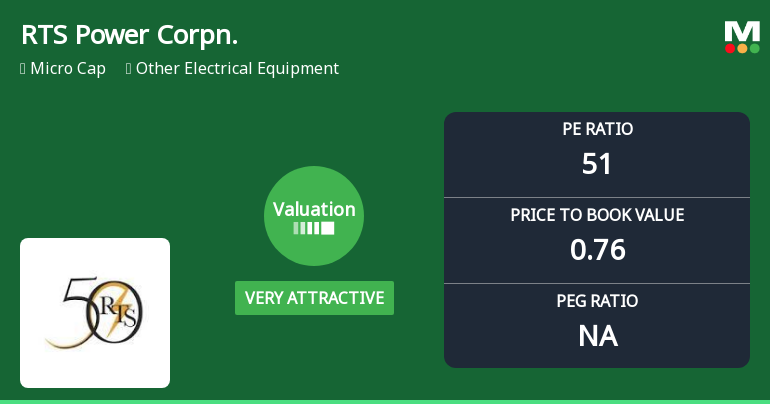
RTS Power Corporation Ltd Valuation Shifts Signal Renewed Price Attractiveness
RTS Power Corporation Ltd, a micro-cap player in the Other Electrical Equipment sector, has witnessed a notable shift in its valuation parameters, moving from a fair to a very attractive price range. Despite recent share price declines, the company’s price-to-book value and other key metrics suggest a compelling investment case relative to its historical averages and peer group.
Read full news article Announcements
Announcement under Regulation 30 (LODR)-Newspaper Publication
29-May-2026 | Source : BSEPursuant to Provisions of Regulation 47(3) of SEBI ( Listing Obligations and Disclosure Requirements )Regulations2015 please find enclosed copy of Audited Standalone and Consolidated Financial Results of the Company for the Quarter and Year ended on 31st March2026 as published in English Daily- Business Standard and Regional Newspaper (Bengali)-Arthik Lipi of Kolkata Edition on Friday29th May2026.
Board Meeting Outcome for Approval Of The Audited Standalone And Consolidated Financial Statements Of The Company For The Year Ended On 31St March 2026.
28-May-2026 | Source : BSEApproval of the Audited Standalone and Consolidated Financial Statements of the Company for the year ended on 31st March 2026 and Audited Standalone and Consolidated Financial Results of the company for the Quarter and Financial Year ended on 31st March 2026 all of which has been reviewed by the Audit Committee of the Board of Directors of the Company in its meeting held this morning for submission to the Stock Exchange
Compliances-Reg.24(A)-Annual Secretarial Compliance
28-May-2026 | Source : BSEAs per requirement of Reg 24A of the Securities and Exchange Board of India LODR Regulation2015 we are enclosing herewith a copy of the Compliance Report issued by Mr. Manoj Prasad Shaw Practicing Company Secretary ( FCS : 5517 ) for the year ended on 31st March2026.
Corporate Actions

No Upcoming Board Meetings

RTS Power Corporation Ltd has declared 5% dividend, ex-date: 22 Sep 11

No Splits history available

No Bonus history available

No Rights history available
Quality key factors
Valuation key factors
Technicals key factors
 Technical Indicator Scale: Bearish, Mildly Bearish, Sideways, Mildly Bullish, Bullish Turned
 Shareholding Snapshot : Mar 2026
Shareholding Compare (%holding)
Promoters
None
Held by 0 Schemes
Held by 0 FIIs
Bhutoria Investments P Ltd (32.43%)
None
21.88%
Quarterly Results Snapshot (Consolidated) - Mar'26 - QoQ

QoQ Growth in quarter ended Mar 2026 is 35.07% vs -10.55% in Dec 2025

QoQ Growth in quarter ended Mar 2026 is -214.02% vs 80.22% in Dec 2025
Half Yearly Results Snapshot (Consolidated) - Sep'25
Growth in half year ended Sep 2025 is -21.70% vs 71.89% in Sep 2024
Growth in half year ended Sep 2025 is -47.65% vs 94.19% in Sep 2024
Nine Monthly Results Snapshot (Consolidated) - Dec'25
YoY Growth in nine months ended Dec 2025 is -20.93% vs 53.43% in Dec 2024
YoY Growth in nine months ended Dec 2025 is -16.36% vs 20.74% in Dec 2024
Annual Results Snapshot (Consolidated) - Mar'26
YoY Growth in year ended Mar 2026 is -20.13% vs 43.21% in Mar 2025
YoY Growth in year ended Mar 2026 is -36.75% vs -15.01% in Mar 2025
About RTS Power Corporation Ltd

Company Coordinates


